Pass Six Sigma Green Belt Certification Exam in First Attempt Guaranteed!
Get 100% Latest Exam Questions, Accurate & Verified Answers to Pass the Actual Exam!
30 Days Free Updates, Instant Download!


LSSGB Premium Bundle
- Premium File 162 Questions & Answers. Last update: Jun 11, 2026
- Training Course 212 Video Lectures
- Study Guide 664 Pages
LSSGB Premium Bundle
- Premium File 162 Questions & Answers
Last update: Jun 11, 2026 - Training Course 212 Video Lectures
- Study Guide 664 Pages
Purchase Individually

Premium File

Training Course

Study Guide


LSSGB Exam - Lean Six Sigma Green Belt
| Download Free LSSGB Exam Questions |
|---|
Six Sigma Six Sigma Green Belt Certification Practice Test Questions and Answers, Six Sigma Six Sigma Green Belt Certification Exam Dumps
All Six Sigma Six Sigma Green Belt certification exam dumps, study guide, training courses are prepared by industry experts. Six Sigma Six Sigma Green Belt certification practice test questions and answers, exam dumps, study guide and training courses help candidates to study and pass hassle-free!
Introducing the Six Sigma Green Belt
The Six Sigma Green Belt certification is a crucial credential for professionals who are actively involved in process improvement. A certified Green Belt is an individual who has been trained in the Six Sigma methodology and is equipped to lead improvement projects. While they may not dedicate their entire role to Six Sigma like a Black Belt, they spend a significant portion of their time applying its principles to enhance processes within their primary job function. They are the agents of change at the departmental level.
A Green Belt's training provides them with a thorough knowledge of the DMAIC framework. They learn how to define a problem, measure its current state, analyze its root causes, implement effective improvements, and control the process to sustain the gains. This training goes beyond theory, focusing on the practical application of various tools, including process mapping, statistical analysis, and risk management techniques. They become proficient in using these tools to transform raw data into actionable insights that lead to tangible business results.
In a typical organizational structure, Green Belts serve as vital team members on larger projects led by Black Belts, but more importantly, they are empowered to lead their own smaller-scale projects. This allows the organization to tackle a greater number of improvement opportunities simultaneously. They are the bridge between Six Sigma theory and practical application on the front lines of the business. By solving problems that affect quality, cost, and efficiency in their local areas, Green Belts contribute directly to the organization's bottom line and its commitment to customer satisfaction.
Why Businesses Embrace Six Sigma
Organizations across nearly every industry have adopted Six Sigma for a compelling reason: it delivers tangible and sustainable results. The primary driver for its implementation is often financial. By systematically identifying and eliminating sources of waste and inefficiency, Six Sigma projects lead to significant cost reductions. These savings can come from reduced scrap and rework, lower warranty claims, optimized inventory levels, and more efficient use of resources. The return on investment for a well-executed Six Sigma program can be substantial, directly boosting profitability.
Beyond cost savings, Six Sigma leads to dramatic improvements in customer satisfaction and loyalty. The methodology's core focus on understanding and meeting customer requirements ensures that improvement efforts are aligned with what the market values. By reducing defects and creating more reliable products and services, companies can enhance their reputation and build stronger customer relationships. A satisfied customer is more likely to become a repeat customer and a positive advocate for the brand, which is an invaluable competitive advantage in today's crowded marketplace.
Finally, implementing Six Sigma fosters a powerful culture of continuous improvement and data-driven decision-making. It empowers employees at all levels with the tools and confidence to solve problems. This creates a more engaged and analytical workforce. When an entire organization begins to think in terms of processes, data, and root causes, it becomes more agile, more efficient, and better equipped to handle future challenges. This cultural transformation is perhaps the most profound and lasting benefit, ensuring that the organization continues to evolve and excel long after individual projects are completed.
An Overview of the DMAIC Framework
The DMAIC framework is the heart of the Six Sigma methodology, providing a structured and disciplined approach to problem-solving. It is an acronym for the five interconnected phases of an improvement project: Define, Measure, Analyze, Improve, and Control. This sequential process ensures that teams do not jump to conclusions or implement solutions before a problem is fully understood. By following these five phases, organizations can be confident that their improvement efforts are based on data, address the true root causes of issues, and result in sustainable, long-term gains.
The journey begins with the Define phase, where the project team clarifies the problem, identifies the goals, and understands the customer requirements. This phase sets the foundation for the entire project. Next, the Measure phase focuses on collecting data to quantify the current process performance and establish a baseline. This is where the magnitude of the problem is precisely understood. The Analyze phase then uses this data to investigate and identify the root cause or causes of the problem, separating the vital few factors from the trivial many.
Once the root causes are confirmed, the project moves into the Improve phase. Here, the team brainstorms, evaluates, and implements solutions designed to eliminate the identified root causes. The goal is to develop creative and effective countermeasures that will lead to a demonstrable improvement in performance. Finally, the Control phase is about sustaining the gains. The team develops monitoring plans, updates documentation, and institutes controls to ensure the improved process remains stable and does not revert to its old ways. This five-phase cycle provides a repeatable and reliable roadmap for achieving operational excellence.
The Define Phase: Setting the Foundation for Success
The Define phase is the critical first step in any Six Sigma DMAIC project. Its primary purpose is to clearly articulate the business problem, the project goals, the scope, and the customer requirements. Without a well-executed Define phase, a project can easily lose direction, address the wrong issue, or fail to deliver meaningful results. This stage ensures that the entire team, along with key stakeholders and leadership, has a shared understanding of what needs to be accomplished and why it is important to the organization.
A key activity in this phase is developing a comprehensive problem statement. This is not a vague complaint but a concise, data-driven description of the issue. It should quantify the problem whenever possible, specifying what is wrong, where it is occurring, and what its impact is. For example, instead of saying "customer deliveries are late," a good problem statement might be, "In the last quarter, 25% of deliveries to the western region arrived more than two days past the promised date, resulting in a 15% increase in customer complaints."
Another crucial element of the Define phase is identifying the project's customers and their critical-to-quality (CTQ) requirements. These are the key measurable characteristics of a product or service that must be met to satisfy the customer. The team must determine what is truly important to both internal and external customers. By focusing on these CTQs, the project remains aligned with delivering value. This foundational work ensures that the team's efforts are precisely targeted at solving a significant problem and meeting the expectations of those who matter most.
Key Tools and Deliverables of the Define Phase
To successfully navigate the Define phase, Six Sigma practitioners utilize several key tools and create specific deliverables that provide structure and clarity. The most important deliverable is the Project Charter. This is a formal document that serves as an agreement between the project team and management. It outlines the business case for the project, the problem and goal statements, the project scope, key milestones, the team members and their roles, and the expected benefits. The charter acts as a contract, authorizing the team to proceed and providing a constant reference point throughout the project's lifecycle.
Another powerful tool used in this phase is the SIPOC diagram. SIPOC is an acronym for Suppliers, Inputs, Process, Outputs, and Customers. This high-level process map helps the team visualize the key elements of the process under investigation. It identifies who provides the necessary inputs, what those inputs are, the major steps in the process, the resulting outputs, and who the customers of those outputs are. Creating a SIPOC diagram helps to define the project's boundaries and ensures that everyone understands the scope of the process being improved.
To capture customer needs, teams often use the Voice of the Customer (VOC) tool. This involves systematically gathering and analyzing customer feedback through methods like surveys, interviews, focus groups, and complaint data. The goal is to translate subjective customer wants and needs into specific, measurable CTQ requirements. For instance, a customer's desire for a "fast" service might be translated into a CTQ of "service completion in under 15 minutes." These tools and deliverables ensure that the Define phase is thorough, building a solid and agreed-upon foundation before any data collection or analysis begins.
The Measure Phase: Quantifying the Problem
Once the project has been clearly defined, the team moves into the Measure phase. The primary objective of this phase is to collect data and establish a reliable baseline of the current process performance. This is where the problem statement from the Define phase is validated with hard numbers. The mantra of the Measure phase is "you can't improve what you don't measure." Without accurate data, it is impossible to know the true extent of a problem, identify its causes, or determine if implemented solutions have had the desired effect.
The first step in this phase is to develop a detailed data collection plan. This plan specifies exactly what will be measured, how it will be measured, who will collect the data, and over what period. It is crucial to ensure that the data collected is both relevant to the problem and reliable. This often involves creating clear operational definitions for each metric to ensure that everyone is measuring in the same consistent way. For example, if measuring "on-time delivery," the team must agree on the exact definition of what constitutes "on-time."
A critical component of the Measure phase is conducting a Measurement System Analysis (MSA). An MSA, also known as a Gage R&R study, evaluates the accuracy and consistency of the measurement system itself. It determines how much of the observed variation is due to the actual process and how much is due to errors in the way measurements are being taken. If the measurement system is unreliable, the data collected will be misleading, potentially leading the team to incorrect conclusions in the Analyze phase. Ensuring data integrity is a non-negotiable prerequisite for a successful project.
Data Collection Strategies in the Measure Phase
Effective data collection is a cornerstone of the Measure phase. The strategy chosen depends heavily on the nature of the process and the type of data required. Data can be broadly categorized as either continuous or discrete. Continuous data is measurable and can take on any value within a range, such as time, temperature, or weight. Discrete data, also known as attribute data, is countable and involves classifications, such as pass/fail, yes/no, or the number of errors on a form. Understanding which type of data is needed is the first step in creating a robust collection plan.
For new data collection, teams must decide between various methods. Manual data collection using check sheets or forms is common for processes that are not automated. This requires clear instructions and training for those collecting the data to ensure consistency. For automated processes, data can often be extracted directly from company databases or information systems. This method is generally faster and less prone to human error, but it requires careful validation to ensure the data accurately reflects the process being studied.
Sampling is another critical consideration. It is often impractical or impossible to collect data from every single output of a process. Instead, teams collect a representative sample. The sampling strategy must be carefully designed to avoid bias. Techniques like random sampling, where every item has an equal chance of being selected, or stratified sampling, which involves dividing the population into subgroups, help ensure that the sample accurately reflects the overall process. A well-designed sampling plan provides reliable data without the cost and effort of measuring the entire population.
Introduction to Basic Statistics for Green Belts
A foundational understanding of basic statistics is essential for any Six Sigma Green Belt, particularly during the Measure and Analyze phases. These statistical tools are used to summarize data, understand its characteristics, and visualize its distribution. One of the most fundamental concepts is measures of central tendency, which describe the center point of a data set. The most common measures are the mean, median, and mode. The mean is the arithmetic average, the median is the middle value, and the mode is the most frequently occurring value.
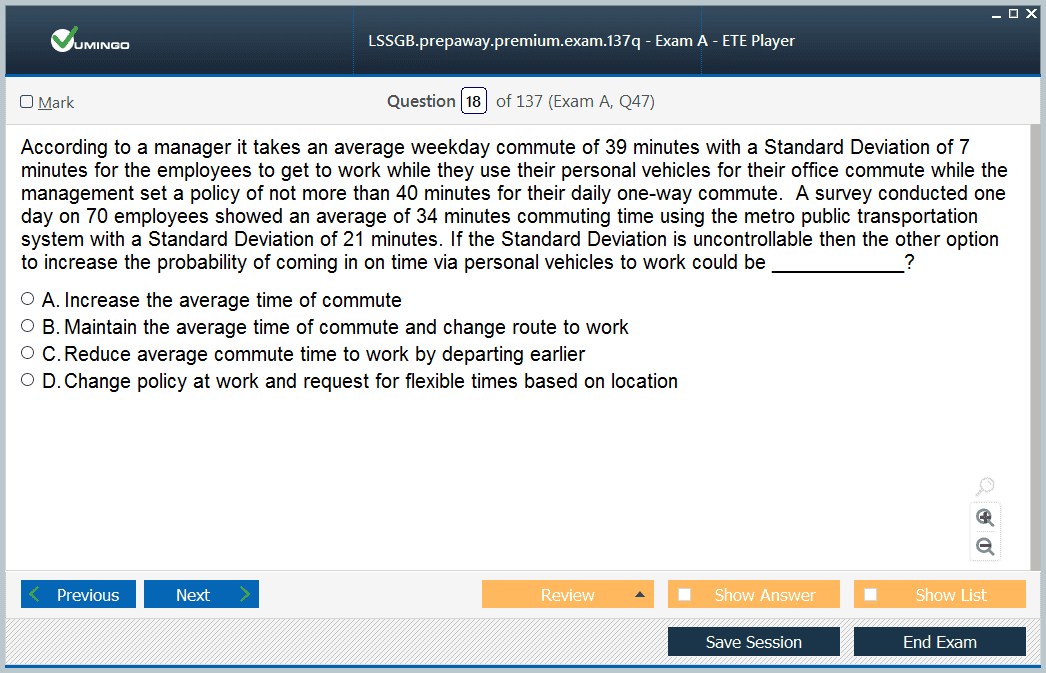
In addition to understanding the center, it is crucial to understand the spread or dispersion of the data. Measures of variation describe how tightly clustered or spread out the data points are. The range is the simplest measure, calculated as the difference between the highest and lowest values. A more powerful measure is the standard deviation, which quantifies the average amount of variation around the mean. A low standard deviation indicates that the data points tend to be very close to the mean, signifying a consistent process.
Visual tools are also incredibly important for interpreting data. A histogram is a bar chart that shows the frequency distribution of a data set. It allows the team to quickly see the shape of the distribution, its central tendency, and its spread. Another useful tool is a run chart, which plots data points over time. This helps to identify trends, shifts, or patterns in the process performance. These basic statistical and graphical tools allow Green Belts to transform raw numbers into meaningful information about their process.
Process Capability Analysis: Is Your Process Good Enough?
After collecting and analyzing baseline data, a key activity in the Measure phase is to perform a process capability analysis. This analysis answers a critical question: is the current process capable of consistently meeting the customer's requirements? It compares the voice of the process (the actual performance and variation) with the voice of the customer (the specification limits or requirements). This provides a quantitative assessment of the process's ability to produce defect-free output.
The analysis uses capability indices, such as Cp and Cpk, to express this relationship as a single number. The Cp index measures the potential capability of a process, assuming it is perfectly centered. It compares the width of the customer's specification limits to the width of the process's natural variation. A Cp value of 1.0 means the process variation just fits within the specification limits. A value greater than 1.33 is generally considered good.
The Cpk index is often more useful as it accounts for whether the process is centered. A process can have a high Cp but still produce defects if its average is shifted to one side of the specification range. Cpk measures the distance from the process mean to the nearest specification limit. A process must be both on target (centered) and have low variation (a small spread) to achieve a high Cpk. This analysis provides a clear, data-backed understanding of the process's performance and sets a specific target for improvement efforts in the subsequent phases.
Common Pitfalls in the Define and Measure Phases
While the DMAIC framework is robust, teams can encounter several common pitfalls in the early phases that can derail a project. In the Define phase, one of the biggest mistakes is having a poorly defined scope. If the scope is too broad, the project becomes unmanageable and loses focus. If it is too narrow, the team may only address a symptom rather than the larger problem. A well-crafted project charter with clear boundaries is essential to avoid this "scope creep" and keep the team focused on achievable goals.
Another common issue in the Define phase is a lack of stakeholder buy-in. If key leaders, process owners, or team members are not fully committed to the project, it will face constant resistance and a lack of resources. It is the project leader's responsibility to clearly communicate the business case for the project and ensure that all relevant parties understand its importance and agree on the objectives. Without this alignment, the project is unlikely to succeed, regardless of the technical work performed.
In the Measure phase, the most significant pitfall is collecting bad data. This can result from an unreliable measurement system, an inconsistent data collection process, or a poorly designed sampling plan. Decisions made based on flawed data will almost certainly be wrong. This is why conducting a Measurement System Analysis (MSA) is so critical. Rushing through the Measure phase without validating the integrity of the data is a recipe for failure, as it invalidates all subsequent analysis and conclusions. Taking the time to get the measurement right is a crucial investment.
The Analyze Phase: Uncovering the Root Causes
After establishing a reliable baseline of performance in the Measure phase, the project team transitions to the Analyze phase. The primary objective here is to use the collected data to identify, validate, and select the root causes of the problem. This phase is fundamentally about moving from observing the effects of a problem to understanding its underlying causes. It is a detective-work stage that requires critical thinking and the application of statistical and qualitative tools to sift through potential causes and pinpoint the vital few factors that are driving the issue.
The phase begins with brainstorming potential causes for the observed problem. The team generates a comprehensive list of all possible factors that could be contributing to the variation or defects. This involves tapping into the collective knowledge of team members, subject matter experts, and those who work directly with the process. It is important to cast a wide net at this stage to ensure no significant cause is overlooked. The goal is to create a list of theories or hypotheses that can then be systematically investigated.
Once a list of potential causes has been generated, the team must use data to validate which of these are the true root causes. This is the core of the Analyze phase. It involves using graphical and statistical tools to explore relationships between process inputs (the potential causes) and the project's key output metric. The aim is to separate correlation from causation and prove with data which factors have a statistically significant impact on the problem. Skipping this validation step and acting on assumptions is a common reason why improvement efforts fail to produce lasting results.
Essential Root Cause Analysis Tools
To effectively identify root causes, Six Sigma practitioners rely on a variety of proven tools. One of the most common and effective qualitative tools is the Cause and Effect Diagram, also known as a Fishbone or Ishikawa diagram. This tool helps teams brainstorm and organize potential causes into logical categories. The 'head' of the fish represents the problem or effect, and the 'bones' represent different categories of potential causes, such as People, Process, Materials, Machine, Measurement, and Environment. This visual framework encourages comprehensive thinking.
Another simple yet powerful technique is the 5 Whys. This method involves repeatedly asking the question "Why?" to peel back the layers of a problem and uncover its deeper, underlying cause. By asking "Why?" at least five times, teams can move beyond obvious symptoms to the foundational issue. For example, if a machine stopped (the problem), the first "Why?" might be because it overloaded. The second "Why?" might be because the bearing was not sufficiently lubricated, and so on, until the true root cause, such as a faulty lubrication pump, is identified.
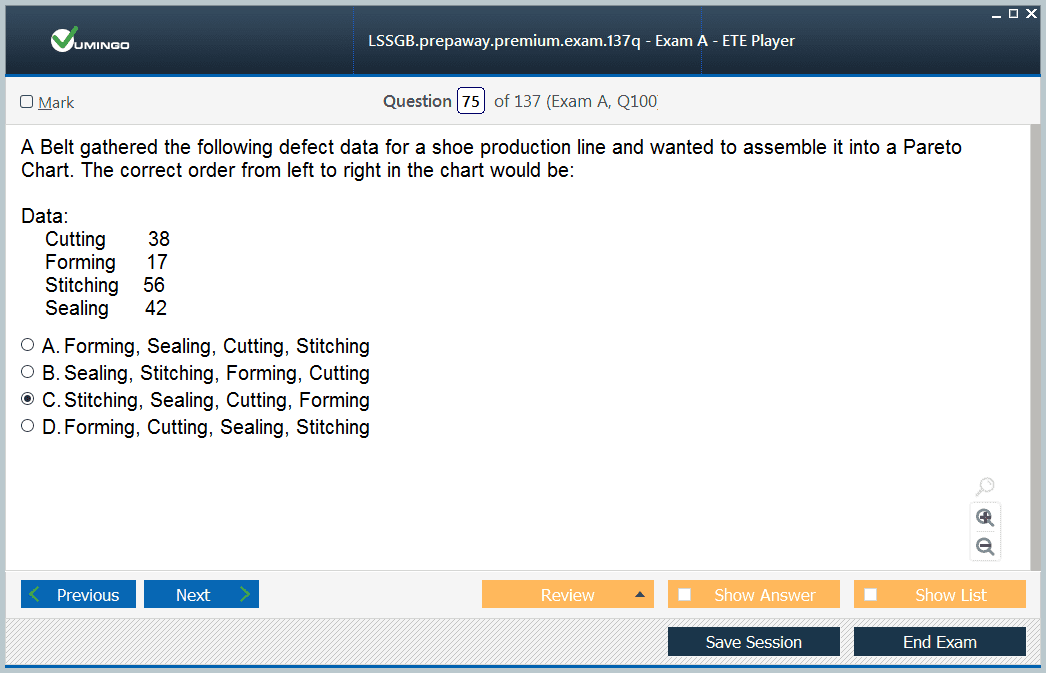
For a more quantitative approach, teams often use tools like the Pareto Chart. A Pareto Chart is a bar chart that displays the frequency of causes, ordered from the most frequent to the least frequent. It is based on the Pareto principle, or the 80/20 rule, which suggests that for many events, roughly 80% of the effects come from 20% of the causes. This chart helps teams focus their limited resources on the "vital few" causes that will have the greatest impact on improving the process, rather than getting distracted by the "trivial many."
Hypothesis Testing: Validating Your Assumptions
While brainstorming tools help generate theories, hypothesis testing provides a structured statistical method to validate whether these theories are true. Hypothesis testing allows teams to use sample data to make inferences about an entire population. It helps determine with a certain level of confidence whether a suspected process input has a statistically significant effect on the process output. This provides a data-driven way to confirm root causes before investing time and resources in developing solutions.
The process begins by stating a null hypothesis (H0) and an alternative hypothesis (Ha). The null hypothesis typically represents the status quo, stating that there is no relationship or no difference between variables. The alternative hypothesis is what the team is trying to prove, stating that a relationship or difference does exist. For example, the null hypothesis might be "the new supplier's material has no effect on product strength," while the alternative would be "the new supplier's material does affect product strength."
The team then collects data and uses a statistical test (such as a t-test or ANOVA) to calculate a p-value. The p-value is the probability of observing the collected data if the null hypothesis were true. A small p-value (typically less than 0.05) indicates that the observed data is unlikely to have occurred by random chance alone. In this case, the team would reject the null hypothesis in favor of the alternative, concluding that the factor being tested has a significant impact. This rigorous process ensures that decisions are based on statistical evidence.
The Improve Phase: Developing and Implementing Solutions
Once the team has successfully identified and validated the root causes in the Analyze phase, the project moves into the Improve phase. The focus now shifts from understanding the problem to developing and implementing effective solutions to fix it. This is a creative and action-oriented phase where the team brainstorms potential solutions, evaluates them, selects the best ones, and puts them into practice. The ultimate goal is to eliminate the root causes and achieve a measurable improvement in the process performance.
The phase typically starts with a brainstorming session to generate a wide range of potential solutions. It is important to encourage creative thinking and not to dismiss any ideas prematurely. Techniques like affinity diagrams can be used to group and organize these ideas into logical categories. The team should aim to develop solutions that directly address the validated root causes. For example, if the root cause of late deliveries was an inefficient packing process, potential solutions might include redesigning the workstation layout or implementing a new scanning system.
After generating a list of potential solutions, the team must carefully evaluate them. This often involves using a solution selection matrix to score each option against predefined criteria, such as effectiveness, cost, time to implement, and potential risks. This structured approach helps the team make an objective decision rather than choosing a solution based on personal preference. The selected solution or solutions should then be tested on a small scale through a pilot test. This allows the team to verify the solution's effectiveness and identify any unforeseen issues before a full-scale rollout.
Brainstorming and Selecting Effective Solutions
Effective brainstorming is crucial for generating innovative solutions in the Improve phase. To ensure a productive session, it is important to establish clear ground rules, such as encouraging wild ideas, deferring judgment, building on the ideas of others, and aiming for quantity over quality initially. The project leader should facilitate the session to ensure everyone participates and the conversation stays focused. The goal is to create a safe and open environment where the team feels comfortable sharing creative and unconventional thoughts that could lead to a breakthrough solution.
Once a robust list of ideas has been generated, the process of selection begins. A common pitfall is to immediately jump to the easiest or most obvious solution. A more disciplined approach is necessary to select the solution with the best overall value. The team should develop clear selection criteria that are aligned with the project goals and the organization's priorities. These criteria typically include the potential impact on the problem, the cost of implementation, the resources required, the timeline, and the level of risk involved.
Using a tool like a Pugh matrix or a solution selection matrix adds objectivity to this process. Each potential solution is scored against each criterion, and the scores are weighted based on the importance of the criteria. This results in a total score for each solution, making it easier to compare them and select the best option. This structured evaluation process ensures that the chosen solution is not only technically sound but also practical and aligned with business constraints, increasing the likelihood of a successful and sustainable implementation.
Pilot Testing and Solution Implementation
Before implementing a chosen solution across the entire process, it is almost always a wise practice to conduct a pilot test. A pilot is a small-scale trial of the proposed change in a controlled environment. The purpose of the pilot is to test the solution under real-world conditions to confirm that it works as expected and to identify any unintended consequences. It provides an opportunity to gather data on the solution's effectiveness and to work out any bugs before investing in a full-scale implementation.
During the pilot, the team should collect data using the same metrics established in the Measure phase. This allows for a direct comparison of the "before" and "after" performance, providing concrete evidence of the improvement. The pilot also provides a chance to gather feedback from the employees who will be using the new process. This feedback is invaluable for refining the solution and for developing effective training and communication plans, which helps to reduce resistance to change during the full rollout.
Once the pilot has proven the solution to be effective, the team can develop a detailed implementation plan for the full-scale rollout. This plan should outline all the necessary tasks, assign responsibilities, establish a timeline, and identify the required resources. It should also include a communication plan to keep all stakeholders informed and a training plan to ensure employees have the skills to execute the new process correctly. A well-managed implementation is crucial for translating a good solution into a successful business result.
The Control Phase: Sustaining the Gains
The final phase of the DMAIC methodology is the Control phase. Its purpose is to ensure that the improvements achieved in the previous phase are sustained over the long term. Many improvement projects fail not because the solution was ineffective, but because the process was allowed to revert to its old habits over time. The Control phase is about putting systems and procedures in place to lock in the gains and prevent backsliding. This phase formally closes out the project and hands over ownership of the new, improved process to the process owner.
A key activity in this phase is to develop a process control plan. This plan documents how the improved process will be monitored to ensure it remains stable and in control. It specifies which key process metrics will be tracked, how they will be measured, how often they will be checked, and what actions should be taken if the process starts to deviate from the desired performance level. This plan serves as a guide for the process owner and their team to manage the process effectively on an ongoing basis.
The team must also update all relevant documentation to reflect the changes made to the process. This includes standard operating procedures (SOPs), training materials, and process maps. Clear and current documentation is essential for ensuring that all employees, including new hires, understand and follow the new standard method. By creating robust monitoring systems and institutionalizing the new process through documentation and training, the Control phase ensures that the hard-won benefits of the Six Sigma project are not lost.
Control Charts and Process Monitoring
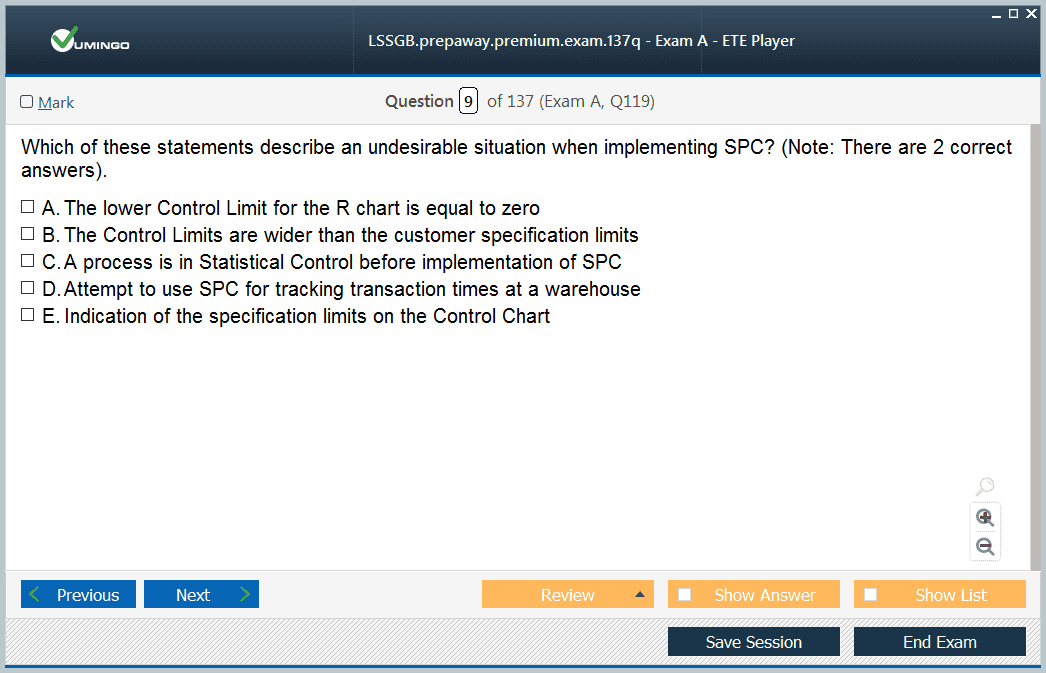
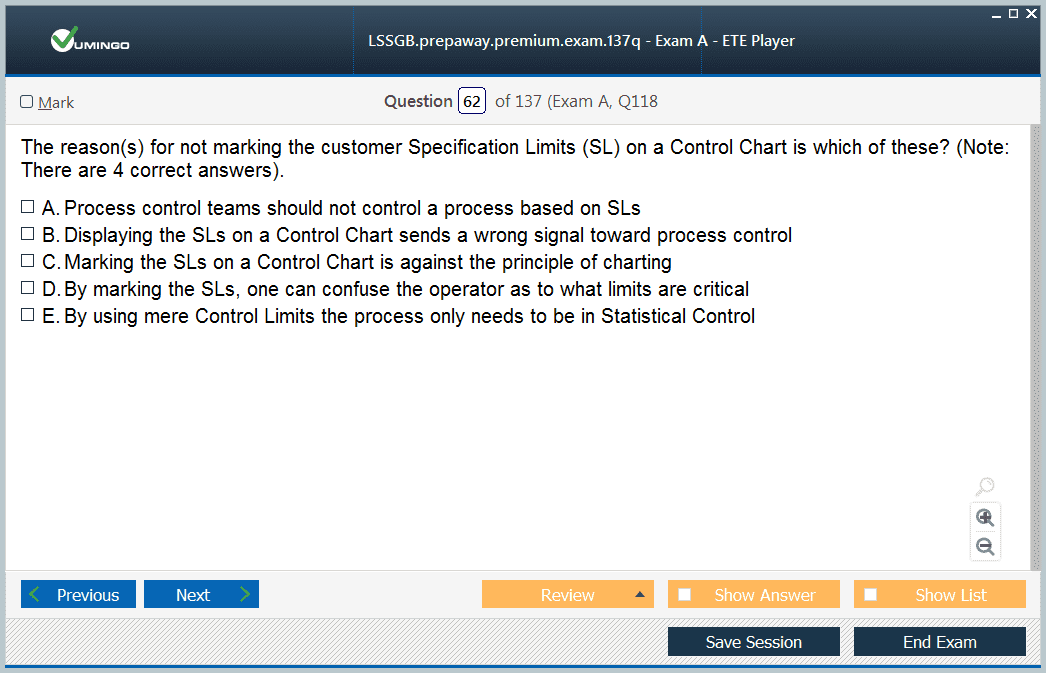
A primary tool used in the Control phase for ongoing process monitoring is the Statistical Process Control (SPC) chart, commonly known as a control chart. A control chart is a run chart with statistically calculated upper and lower control limits. These limits represent the natural, inherent variation of the process when it is operating correctly. As long as the data points plotted on the chart fall randomly between these limits, the process is considered to be "in control" or stable.
Control charts are powerful because they help to distinguish between two types of variation: common cause and special cause. Common cause variation is the natural, inherent noise within a stable process. Special cause variation is due to specific, assignable events that are not part of the normal process, such as a machine malfunction or an operator error. A data point that falls outside the control limits or a non-random pattern within the limits signals the presence of a special cause.
By monitoring the control chart, the process owner can see in real-time if something has changed. If a special cause is detected, it triggers an immediate investigation to identify and correct the problem before it produces a significant number of defects. This allows for proactive management of the process. The control chart provides an early warning system, enabling teams to maintain process stability and ensuring that the gains achieved during the improvement project are sustained day after day.
Documenting the Process and Handing Over the Project
A crucial and often overlooked aspect of the Control phase is the formal documentation and handover of the project. The Six Sigma team's role is temporary; they are brought in to solve a problem and then they move on to the next project. For the improvements to last, ownership must be transferred to the person responsible for the process in the long run, known as the process owner. A formal handover meeting is essential to ensure this transition is smooth and successful.
During this handover, the team presents the final project report, which summarizes the work done in each phase of DMAIC. This report should include the problem statement, the baseline data, the analysis that identified the root causes, the solution that was implemented, and the final results. Most importantly, the team must walk the process owner through the process control plan. This ensures the process owner understands what needs to be monitored, what the control limits are, and what to do if the process becomes unstable.
Finalizing all documentation is a critical deliverable. This includes updating work instructions, standard operating procedures, and training manuals to reflect the new process. This institutionalizes the change and makes it the new standard way of working. By providing the process owner with a robust control plan and clear, up-to-date documentation, the project team equips them with everything they need to maintain the gains. This formal closure ensures accountability and is the final step in delivering a successful and sustainable improvement.
The Role and Responsibilities of a Six Sigma Green Belt
A Six Sigma Green Belt plays a pivotal role in an organization's continuous improvement journey. They are practitioners who have been trained in the Six Sigma methodology and are capable of leading small to medium-sized improvement projects. Unlike Black Belts, who often work on improvement projects full-time, Green Belts typically spend a portion of their time on these initiatives while maintaining their regular job responsibilities. This dual role makes them invaluable, as they possess both process improvement skills and deep functional knowledge of their specific work area.
The primary responsibility of a Green Belt is to lead a project team through the DMAIC framework to solve a defined business problem. This involves defining the project scope, gathering and analyzing data, identifying root causes, implementing solutions, and establishing controls to sustain the gains. They are the project managers and the primary technical resource for their projects, responsible for keeping the team on track, managing timelines, and ensuring the project delivers its intended results.
Beyond leading their own projects, Green Belts are also expected to serve as valuable team members on larger, more complex projects led by Black Belts. In this capacity, they assist with data collection, analysis, and the implementation of solutions. Furthermore, Green Belts act as champions for the Six Sigma culture within their departments. They help to promote a mindset of data-driven decision-making and continuous improvement among their peers, effectively serving as agents of change at the grassroots level of the organization.
Leading a Green Belt Project: From Start to Finish
Leading a Six Sigma project requires a blend of technical expertise and strong project management skills. The journey begins with project selection and definition. Green Belts often identify potential projects within their own area of work, focusing on issues that affect quality, cost, or delivery. Once a project is selected, the first task is to create a detailed project charter. This document, developed in collaboration with a project champion or sponsor, clarifies the problem, sets clear goals, and defines the scope, ensuring alignment with business objectives from the very beginning.
With the charter approved, the Green Belt guides the team through the DMAIC phases. They facilitate brainstorming sessions, develop data collection plans, and perform statistical analysis. A key part of their role is to keep the project moving forward by setting clear milestones and holding regular team meetings to review progress and address any roadblocks. They are responsible for ensuring that the team follows the structured DMAIC process and does not skip crucial steps, such as validating root causes before jumping to solutions.
Throughout the project, the Green Belt serves as the primary communicator. They must provide regular updates to the project champion, stakeholders, and the guiding Black Belt or Master Black Belt. This includes preparing and presenting formal project reviews, or "tollgate" reviews, at the end of each DMAIC phase. These reviews are critical checkpoints to ensure the project is on track and has met the deliverables for that phase before proceeding to the next. Finally, upon completion, the Green Belt is responsible for documenting the results and formally handing over the improved process to the process owner.
Working with Teams and Stakeholders
A Green Belt's success is heavily dependent on their ability to work effectively with people. Six Sigma projects are not solo efforts; they require the collaboration of a diverse team. The Green Belt is responsible for assembling a project team, which should include individuals who work directly with the process being improved. These team members bring invaluable subject matter expertise. The Green Belt must foster a collaborative environment where all team members feel empowered to contribute their ideas and insights.
Effective facilitation is a key skill. The Green Belt must be able to lead team meetings, guide brainstorming sessions, and manage group dynamics. This includes navigating disagreements and building consensus around key decisions. They need to ensure that the team stays focused on the project's objectives and makes decisions based on data rather than on opinions or internal politics. This requires strong interpersonal and leadership skills to motivate the team and maintain momentum throughout the project.
Managing stakeholders is another critical responsibility. Stakeholders are anyone who has an interest in or is affected by the project, including managers, customers, suppliers, and employees in other departments. The Green Belt must identify these stakeholders early on and develop a communication plan to keep them informed and engaged. Gaining their buy-in and addressing their concerns proactively is essential for overcoming resistance to change and ensuring a smooth implementation of the final solution. Strong stakeholder management is often the difference between a project that succeeds and one that fails.
The Green Belt's Statistical Toolkit
While Green Belts are not expected to be master statisticians like Black Belts, they must be proficient with a core set of statistical and quality improvement tools. These tools are essential for making data-driven decisions throughout the DMAIC process. One of the most frequently used tools is the process map or flowchart. This visual tool helps the team understand the sequence of steps in a process, identify bottlenecks, and pinpoint areas of complexity or redundancy. It is a foundational tool used in the Define phase.
In the Measure and Analyze phases, Green Belts rely on graphical analysis tools to interpret data. Histograms are used to understand the distribution of a data set, revealing its central tendency, spread, and shape. Pareto charts help to prioritize problems or causes by showing which factors are the most significant. Scatter plots are used to investigate the relationship between two variables, helping to identify potential correlations that may point toward a root cause. These visual tools are powerful because they make complex data easy to understand.
Green Belts also use basic statistical calculations to quantify process performance. They must be comfortable calculating measures like mean, median, standard deviation, and process capability (Cp/Cpk). As they advance, they will also be introduced to more sophisticated tools for root cause validation, such as hypothesis testing (e.g., t-tests) and correlation/regression analysis. Mastery of this core toolkit enables Green Belts to move beyond gut feelings and effectively diagnose and solve problems based on factual evidence.
Navigating Project Challenges and Resistance to Change
Even the most well-planned Six Sigma project can encounter challenges. A common hurdle is a lack of resources, whether it be time, funding, or people. Green Belts often have to balance their project responsibilities with their regular job duties, and team members face the same challenge. To overcome this, the Green Belt must be an effective advocate for the project, clearly communicating its value to management to secure the necessary support and ensuring that project work is prioritized appropriately.
Another significant challenge is dealing with data issues. Sometimes the necessary data does not exist and a new collection system must be established. Other times, the available data may be inaccurate or incomplete. The Green Belt must be diligent in verifying the integrity of the measurement system and the data itself. Making decisions based on bad data can lead the project in the wrong direction, so it is crucial to address these issues head-on in the Measure phase.
Perhaps the most difficult challenge is overcoming resistance to change. People are often comfortable with the existing way of doing things, and proposed changes can be met with skepticism or fear. The Green Belt must act as a change agent. This involves communicating openly and honestly about the reasons for the change, involving employees in the development of solutions, and demonstrating the benefits of the new process. By addressing the "people side" of the project, a Green Belt can build buy-in and turn potential resistors into supporters.
The Relationship Between Green Belts and Black Belts
In a mature Six Sigma deployment, Green Belts and Black Belts work together in a symbiotic relationship that is crucial for the program's success. The Black Belt typically serves as a mentor, coach, and technical expert for the Green Belts. While Green Belts are trained to lead their own projects, they often require guidance, especially when they encounter complex statistical problems or difficult project management challenges. The Black Belt provides this support, helping the Green Belt to navigate these obstacles and develop their skills.
Black Belts are responsible for delivering advanced training to Green Belts and for helping them select appropriate projects that are both meaningful to the business and manageable in scope. They review the Green Belt's project charter to ensure it is well-defined and periodically check in on project progress through the tollgate review process. This oversight ensures that Green Belt projects maintain a high standard of quality and rigor, and that they remain aligned with the organization's strategic goals.
This mentorship structure is beneficial for everyone involved. The Green Belt receives valuable on-the-job training and support, which accelerates their professional development and increases the likelihood of their project's success. The Black Belt is able to leverage their expertise across multiple projects, effectively multiplying their impact on the organization. This collaborative model allows the organization to execute a larger number of improvement projects simultaneously, fostering a widespread culture of continuous improvement.
Presenting Project Findings to Leadership
A key responsibility for a Six Sigma Green Belt is to effectively communicate project progress and results to leadership and other stakeholders. This is typically done through formal presentations known as tollgate reviews, which occur at the end of each DMAIC phase. The purpose of these reviews is to demonstrate that the project has met its objectives for the current phase and to get approval to proceed to the next one. A clear and compelling presentation is essential for maintaining leadership support and project momentum.
When preparing for these presentations, the Green Belt should focus on being concise and data-driven. Executives are busy, so the presentation should get straight to the point. The story of the project should be told through charts, graphs, and key metrics rather than long narrative paragraphs. The Green Belt should be prepared to explain the problem statement, show the baseline data, present the analysis that led to the root causes, and describe the proposed solutions and their expected impact.
The final project presentation is particularly important. This is where the Green Belt showcases the overall success of the project. The presentation should clearly quantify the results, both in terms of process improvement (e.g., defect reduction) and financial impact (e.g., cost savings). It should also include a summary of the control plan to assure leadership that the gains will be sustained. The ability to present complex information in a clear, confident, and persuasive manner is a critical skill that distinguishes a successful Green Belt.
Beyond DMAIC: An Introduction to Lean Principles
While Six Sigma is focused on reducing variation and eliminating defects, another powerful continuous improvement methodology known as Lean focuses on eliminating waste and improving process flow. Lean originated in the Toyota Production System and identifies eight primary types of waste: Defects, Overproduction, Waiting, Non-utilized Talent, Transportation, Inventory, Motion, and Extra-processing. The core idea of Lean is to maximize customer value while minimizing waste. It is about creating more value for customers with fewer resources.
Lean thinking emphasizes the concept of value stream mapping. This is a technique used to visualize the entire flow of a product or service, from the initial customer request to the final delivery. By mapping the value stream, teams can identify all the activities involved and classify them as either value-added (things the customer is willing to pay for) or non-value-added (waste). The goal is then to systematically eliminate the non-value-added steps, which shortens lead times, reduces costs, and improves quality.
Other key Lean principles include just-in-time (JIT) production, which aims to produce only what is needed, when it is needed, and in the amount needed. This drastically reduces inventory waste. Another principle is Jidoka, or building quality into the process, which empowers workers to stop the production line if they detect a problem. The focus is on creating a smooth, continuous flow of work, free from interruptions and delays. These principles provide a powerful framework for creating highly efficient and responsive operations.
Lean Six Sigma: The Power of Combining Methodologies
Over time, organizations realized that Lean and Six Sigma are not competing methodologies but are highly complementary. Lean's focus on speed and waste elimination pairs perfectly with Six Sigma's focus on quality and variation reduction. This realization led to the creation of Lean Six Sigma (LSS), an integrated methodology that combines the strengths of both approaches. LSS provides a comprehensive toolkit for solving a wider range of business problems than either methodology could alone.
Lean Six Sigma uses the structured DMAIC framework from Six Sigma as its problem-solving roadmap. However, it integrates Lean tools and principles throughout each phase. For example, during the Define and Measure phases, a team might use value stream mapping to identify waste and bottlenecks. In the Analyze phase, they might use Lean principles to identify sources of non-value-added activity. In the Improve phase, solutions might include Lean techniques like 5S (a workplace organization method) or implementing a pull system to reduce inventory.
By combining these approaches, organizations can tackle problems holistically. A process can be both inefficient (a Lean problem) and inconsistent (a Six Sigma problem). LSS allows a team to address both issues simultaneously. For example, they can reduce the number of steps in a process to make it faster (Lean) while also reducing the error rate at the remaining steps (Six Sigma). This powerful synergy results in processes that are not only high-quality and predictable but also fast, efficient, and cost-effective.
An Overview of Design for Six Sigma (DFSS)
While the DMAIC methodology is excellent for improving existing processes, it is a reactive approach. It fixes problems that are already occurring. Design for Six Sigma (DFSS), on the other hand, is a proactive methodology used to design new products, services, or processes from scratch to a Six Sigma quality level. The goal of DFSS is to understand customer needs upfront and to design a process or product that is "born capable" of meeting those needs without defects from the very beginning.
Instead of DMAIC, DFSS typically follows a framework known as DMADV, which stands for Define, Measure, Analyze, Design, and Verify. The first three phases are similar to DMAIC, focusing on defining goals, understanding customer needs (CTQs), and analyzing design options. However, the Design phase is where DFSS diverges significantly. Here, the team develops a detailed, high-level design for the new product or process, often using predictive modeling and simulation tools to optimize it before it is ever built.
The final phase is Verify. In this phase, the team pilots the new design, runs tests to ensure it performs as expected, and validates that it meets the original customer requirements. A control plan is then implemented before the new product or process is launched. By using DFSS, companies can avoid the costly cycle of launching a new product and then immediately having to use DMAIC projects to fix the inevitable problems. It is a more strategic approach that prevents defects by design.
The Importance of a Supportive Organizational Culture
Implementing a successful Lean Six Sigma program requires more than just training employees and executing projects. It requires a fundamental shift in the organization's culture. For continuous improvement to become truly embedded in the company's DNA, it must be supported by a culture that values data, embraces change, and empowers employees. This cultural transformation must start with a visible and unwavering commitment from senior leadership.
Leaders must do more than just provide funding for training. They must actively champion the program, communicate its importance, and align improvement projects with the company's strategic objectives. They should participate in project reviews, celebrate successes, and hold people accountable for results. When employees see that leadership is genuinely invested in the program, they are far more likely to embrace it themselves. This top-down support is the single most important factor for long-term success.
Furthermore, the culture must foster psychological safety, where employees feel comfortable pointing out problems and suggesting ideas for improvement without fear of blame or punishment. It should be a culture of collaboration, breaking down silos between departments to solve cross-functional problems. It should also be a culture that views failure not as a career-ending event, but as a learning opportunity. Building this type of supportive environment is a long-term effort, but it is essential for creating a true learning organization where continuous improvement can thrive.
Six Sigma Green Belt certification practice test questions and answers, training course, study guide are uploaded in ETE files format by real users. Study and pass Six Sigma Six Sigma Green Belt certification exam dumps & practice test questions and answers are the best available resource to help students pass at the first attempt.


