- Home
- Six Sigma Certifications
- ICGB IASSC Certified Lean Six Sigma Green Belt Dumps
Pass Six Sigma ICGB Exam in First Attempt Guaranteed!
Get 100% Latest Exam Questions, Accurate & Verified Answers to Pass the Actual Exam!
30 Days Free Updates, Instant Download!


ICGB Premium Bundle
- Premium File 143 Questions & Answers. Last update: Jul 25, 2026
- Training Course 21 Video Lectures

Last Week Results!

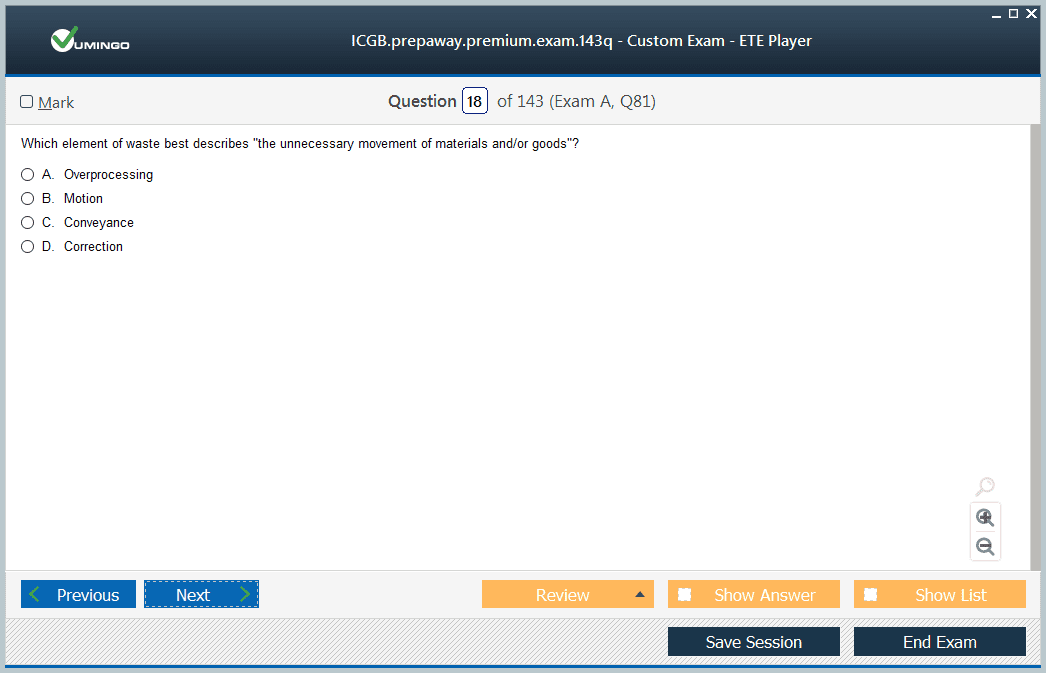
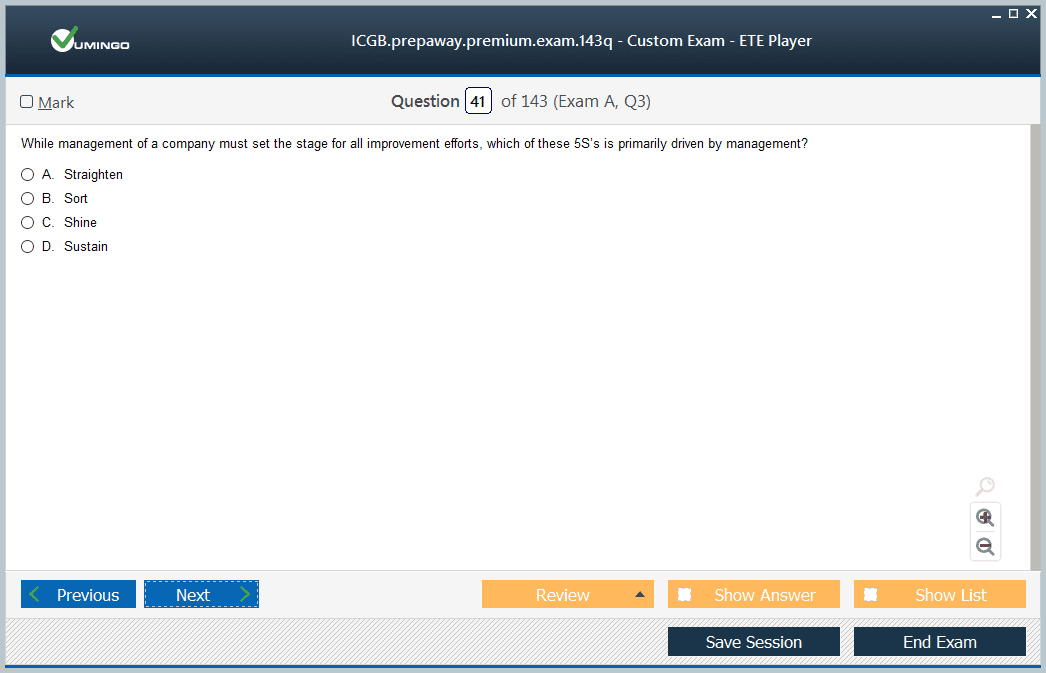
Includes question types found on the actual exam such as drag and drop, simulation, type-in and fill-in-the-blank.
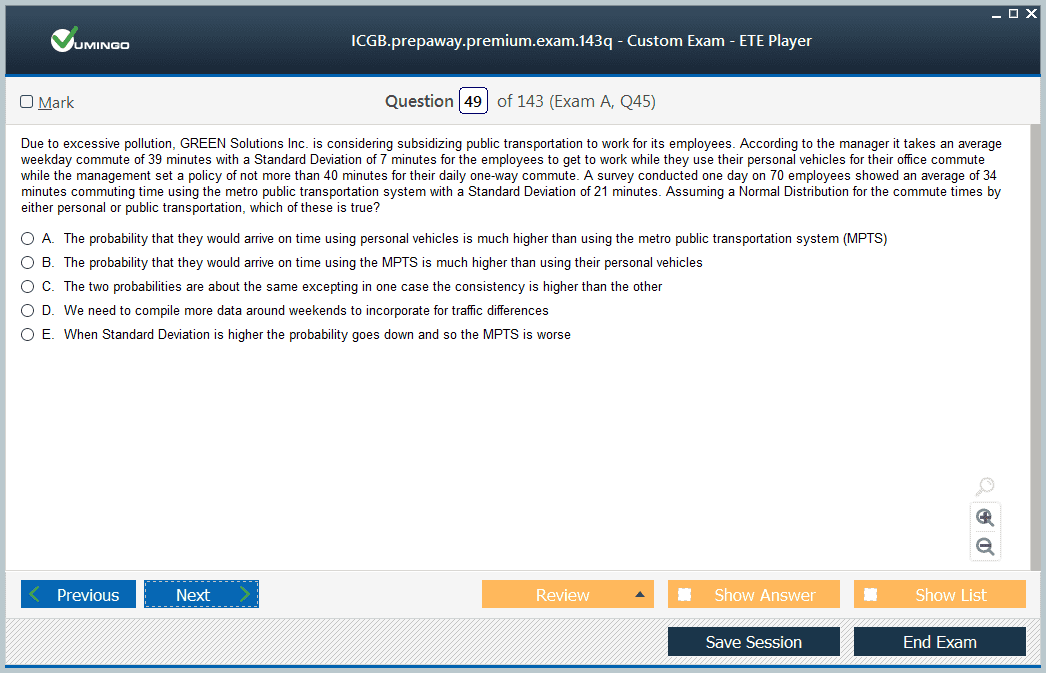
Based on real-life scenarios similar to those encountered in the exam, allowing you to learn by working with real equipment.
All Six Sigma ICGB certification exam dumps, study guide, training courses are Prepared by industry experts. PrepAway's ETE files povide the ICGB IASSC Certified Lean Six Sigma Green Belt practice test questions and answers & exam dumps, study guide and training courses help you study and pass hassle-free!
The Essentials of IASSC Lean Six Sigma Green Belt ICGB Certification
The ICGB certification, known as the Lean Six Sigma Green Belt, is a globally respected credential that reflects proficiency in process improvement methodologies. It demonstrates that an individual has acquired skills to identify inefficiencies, collect and analyze data, and apply structured strategies for continuous improvement. The ICGB credential is more than just a qualification; it is proof of one’s ability to contribute meaningfully to organizational excellence by reducing waste, improving workflows, and enhancing overall productivity.
The Green Belt level represents a significant step in Lean Six Sigma learning. While it does not demand the full-time commitment of a Black Belt, it equips professionals to lead smaller projects independently and actively participate in larger, more complex initiatives under the guidance of higher-level practitioners. It serves as both a practical and theoretical foundation, enabling professionals to build competence in a wide range of improvement tools and statistical methods.
Role and Responsibilities of ICGB Professionals
An ICGB-certified professional takes on responsibilities that bridge the gap between leadership strategies and operational execution. These individuals work closely with teams to ensure that improvement initiatives are not only implemented but are sustainable in the long term. They collect and analyze data to identify the root causes of inefficiencies, design effective solutions, and measure the impact of implemented changes.
Green Belts frequently act as facilitators within teams, supporting communication across departments and encouraging collaboration. Their role is not confined to statistical analysis but extends to ensuring that every project aligns with broader organizational goals. They are expected to engage with stakeholders, define measurable objectives, and demonstrate how outcomes contribute to cost reduction, quality improvement, or customer satisfaction.
Structure of the ICGB Exam
The ICGB exam is structured to test a candidate’s knowledge across the Lean Six Sigma Green Belt body of knowledge. It typically consists of multiple-choice and true-or-false questions designed to evaluate both theoretical understanding and the ability to apply concepts in real-world contexts. The questions cover the full range of DMAIC phases, from defining problems and measuring processes to analyzing data, implementing improvements, and controlling results.
Candidates must demonstrate not only familiarity with Lean Six Sigma terminology but also competence in applying statistical tools, process mapping techniques, and root cause analysis. Time management plays an important role during the exam, as candidates must work through a significant number of questions within a fixed duration. Successful candidates display the ability to combine speed with accuracy, ensuring that answers reflect both knowledge and logical application.
Knowledge Areas Covered
The ICGB certification body of knowledge spans a wide range of domains. It begins with understanding the fundamentals of Lean Six Sigma and the philosophy behind process improvement. Candidates are expected to grasp the concepts of variation, waste reduction, and continuous improvement as guiding principles.
Statistical and analytical tools form another major part of the knowledge areas. Green Belts must be able to interpret control charts, calculate process capability, perform hypothesis testing, and use regression analysis. They are also required to understand and apply tools like cause-and-effect diagrams, Pareto charts, and scatter plots to diagnose problems effectively.
Project management and leadership skills are also emphasized. A Green Belt professional should be capable of planning projects, allocating resources, and working with cross-functional teams. Communication, stakeholder engagement, and the ability to train others on Lean Six Sigma tools are additional competencies assessed through both preparation and practical application.
Skills Developed Through Certification
Earning the ICGB credential allows professionals to acquire a blend of technical, analytical, and interpersonal skills. On the technical side, they learn how to work with process improvement tools, conduct data-driven analysis, and apply statistical techniques to validate findings. This strengthens their ability to make decisions based on facts rather than assumptions.
Analytical skills gained through the certification help candidates break down complex problems into manageable components. By understanding the causes of inefficiencies, professionals can propose actionable solutions that lead to measurable improvements.
Interpersonal skills also play a vital role. A Green Belt professional often interacts with team members across various levels of an organization. The certification journey fosters leadership, communication, and conflict resolution abilities, preparing candidates to function effectively as team players and project leaders.
Practical Application of ICGB Knowledge
The true value of the ICGB certification lies in its practical application within organizations. Certified Green Belts are expected to lead smaller projects aimed at addressing specific challenges, such as reducing cycle time, minimizing defects, or optimizing resource utilization. Their expertise allows them to conduct detailed process evaluations, gather accurate data, and propose improvements that align with business objectives.
For example, a Green Belt might oversee a project designed to streamline customer service operations. By applying Lean Six Sigma principles, they could identify sources of delays, propose solutions such as automation or training, and measure the resulting improvements in response times and customer satisfaction. These kinds of initiatives not only deliver immediate results but also foster a culture of continuous improvement within the organization.
Preparation for the ICGB Exam
Preparing for the ICGB exam requires a structured approach that combines theoretical study with practical application. Candidates should begin by familiarizing themselves with the exam structure, understanding the types of questions, and reviewing the weightage assigned to different topics.
Investing time in quality study materials is essential. Comprehensive guides, practice problems, and simulations of real-world case studies help build a strong foundation. Beyond reading and memorization, candidates should practice applying tools to practical problems, as this not only deepens understanding but also mirrors the kind of scenario-based questions that may appear on the exam.
Taking practice tests is a key element of preparation. These allow candidates to assess their knowledge, identify weak areas, and develop effective time management strategies. Repeated exposure to exam-like conditions reduces anxiety and builds confidence, ensuring that candidates are better prepared to perform under pressure.
Importance of Practical Projects
Engaging in real or simulated projects during preparation offers invaluable experience. These projects allow candidates to apply the DMAIC framework to tangible problems, reinforcing theoretical knowledge through practical application. By working on improvement initiatives, candidates learn how to collect meaningful data, test solutions, and sustain results.
Practical experience also highlights the challenges of implementing changes, such as resistance from team members or difficulties in maintaining improvements over time. By encountering these challenges before the exam, candidates are better prepared to understand the context behind many exam questions and can demonstrate a deeper level of insight.
Broader Impact of ICGB Certification
The ICGB certification is not only beneficial for individuals but also for organizations. For individuals, it serves as proof of analytical capabilities, leadership potential, and commitment to continuous improvement. It strengthens career prospects by opening opportunities for roles that demand process improvement expertise and project management skills.
For organizations, having Green Belt-certified professionals means having a pool of talent capable of tackling operational challenges in a structured manner. Their ability to identify inefficiencies, design solutions, and ensure measurable results supports organizational goals such as cost reduction, quality enhancement, and customer satisfaction. This dual impact makes the certification highly valuable across industries and functions.
Long-Term Value of the Credential
Beyond immediate career and organizational benefits, the ICGB certification offers long-term value. It provides a foundation upon which professionals can build further expertise, such as advancing to Black Belt or even Master Black Belt levels. Each subsequent level represents greater responsibility, leadership, and influence, but the Green Belt remains an essential building block.
The certification also fosters a mindset of continuous learning. By internalizing Lean Six Sigma principles, professionals develop a habit of seeking out inefficiencies, proposing improvements, and measuring results, regardless of their role or industry. This mindset ensures that their value remains relevant throughout their career.
Deep Dive into the ICGB Exam Framework
The ICGB exam is designed to measure both theoretical knowledge and applied skills. It goes beyond surface-level memorization and tests how well candidates can connect concepts to practical scenarios. The exam questions reflect the various stages of the Lean Six Sigma methodology, with particular attention to problem definition, measurement of processes, data analysis, implementation of solutions, and control of improvements. Each section of the exam challenges candidates to demonstrate critical thinking, decision-making, and analytical skills.
While the exam is presented in a standardized format, its essence lies in assessing the candidate’s ability to approach problems logically. Some questions may be straightforward in testing definitions or formulas, but many require applying methods to situations that mimic workplace challenges. This ensures that the certification is not just a theoretical credential but proof of one’s ability to contribute meaningfully to improvement initiatives.
Core Methodologies Assessed
At the heart of the ICGB exam is the DMAIC framework, a structured approach to problem-solving that underpins Lean Six Sigma. Candidates must demonstrate their knowledge in each phase, beginning with defining the scope of a project and understanding the customer requirements. The measure phase tests the ability to capture accurate data, determine process capability, and validate measurement systems.
The analyze phase evaluates skills in identifying root causes, interpreting statistical tests, and applying tools like regression analysis. The improve phase checks knowledge of designing solutions, piloting improvements, and ensuring sustainability. Finally, the control phase tests the candidate’s ability to implement monitoring systems, document standards, and maintain improvements over time. Together, these areas form the backbone of the exam and highlight the comprehensive nature of the certification.
Tools and Techniques Mastered
An ICGB-certified professional must be proficient in a wide variety of tools and techniques. The exam tests familiarity with process mapping, flowcharts, and value stream mapping, which provide a visual representation of workflows. Candidates are also expected to understand statistical tools such as hypothesis testing, correlation analysis, and control charts. These tools ensure that improvement efforts are based on evidence rather than assumptions.
Problem-solving tools like fishbone diagrams, Pareto analysis, and failure mode and effects analysis are equally important. They help professionals identify and prioritize issues, ensuring that resources are directed toward addressing the most impactful problems. Beyond technical tools, the exam also tests knowledge of soft skills, such as facilitation and stakeholder engagement, which are vital for ensuring that solutions are accepted and implemented effectively.
Practical Relevance of Certification
The ICGB certification holds strong practical relevance because it equips professionals with skills that are immediately applicable in organizational contexts. Certified individuals are able to identify inefficiencies, design targeted improvements, and measure results in ways that align with organizational goals. For instance, they might lead initiatives to reduce process cycle times, eliminate redundant steps, or minimize error rates in service delivery.
Their ability to blend analytical skills with team collaboration ensures that improvements are not only technically sound but also embraced by employees. This balance between technical precision and human engagement is a distinguishing feature of ICGB-certified professionals, making them valuable contributors to operational excellence.
Exam Preparation Strategies
Preparing for the ICGB exam requires a combination of study, practice, and application. Candidates often benefit from breaking down the body of knowledge into manageable sections and tackling each systematically. For example, dedicating focused time to statistical tools, followed by project management skills, ensures well-rounded preparation.
Working with sample questions helps build familiarity with the exam format. These practice sessions highlight areas of weakness, enabling candidates to allocate more time to topics that require reinforcement. Beyond practice questions, applying concepts in real-world or simulated projects deepens understanding, as it forces candidates to use tools in practical contexts rather than abstract study.
Time management is a critical component of preparation. The exam requires completing a significant number of questions within a limited duration, so practicing under timed conditions is essential. Developing strategies such as answering easier questions first and returning to more complex ones later helps ensure that no time is wasted.
Role of Work Experience in Certification
Although there are no formal prerequisites for taking the exam, having professional work experience in process-related roles greatly enhances preparation. Work experience allows candidates to connect theory with practice, making it easier to understand concepts like variation, process capability, and defect reduction. By applying Lean Six Sigma tools in real-world situations, professionals develop the intuition needed to answer scenario-based questions effectively.
For example, a professional who has worked on reducing customer complaints might already be familiar with root cause analysis, even if they have not formally studied it. This hands-on familiarity strengthens exam performance, as it allows candidates to interpret questions with greater clarity and confidence.
Application of ICGB Certification in Organizations
Once certified, ICGB professionals play an important role in driving organizational improvement. They are capable of managing smaller-scale projects independently, addressing targeted issues such as reducing waste in production or streamlining administrative workflows. Their projects often deliver measurable results that contribute to cost savings, efficiency gains, and higher customer satisfaction.
In addition to leading their own projects, Green Belts frequently serve as valuable team members in larger, more complex initiatives. In these cases, they support senior practitioners by collecting and analyzing data, preparing reports, and ensuring that proposed solutions are evidence-based. This dual role of independent project leadership and team collaboration underscores the versatility of the ICGB certification.
Continuous Development Beyond Certification
Achieving the ICGB certification is not the end of the journey but the beginning of continuous development. Certified professionals are encouraged to keep applying Lean Six Sigma principles in their daily work, reinforcing what they have learned and discovering new ways to adapt the methodology to evolving challenges. Each new project provides an opportunity to refine skills, expand expertise, and build credibility within the organization.
Continuous development also prepares individuals for advancing to higher levels of Lean Six Sigma knowledge. The Green Belt serves as a foundation, and those who wish to pursue greater responsibilities may eventually move toward advanced certifications. Even if individuals choose not to pursue further formal credentials, the skills and mindset gained through ICGB remain relevant across different roles and industries.
Broader Benefits of ICGB Certification
The benefits of ICGB certification extend beyond individual career advancement. Organizations with certified professionals benefit from having a workforce trained in systematic problem-solving. This creates a culture where decisions are based on data, improvements are measured and sustained, and inefficiencies are continuously challenged. Such an environment fosters innovation, adaptability, and resilience in the face of challenges.
For professionals, the credential builds confidence in handling complex challenges and provides recognition of their expertise. It validates their ability to lead and contribute to improvement projects, making them competitive in a wide range of roles. The skills acquired through the certification are transferable, meaning they can be applied across industries and functions, enhancing long-term career flexibility.
Comprehensive Understanding of ICGB Certification
The ICGB certification demonstrates proficiency in Lean Six Sigma methodology at a level where professionals are capable of managing specific improvement projects and actively contributing to larger-scale initiatives. It builds a structured foundation in the core principles of process optimization, waste reduction, and quality enhancement. This certification ensures that individuals are not only aware of theoretical frameworks but also possess the ability to apply them practically in organizational contexts. The certification represents a balance between leadership and teamwork, preparing professionals to function effectively in both roles.
The ICGB focuses on developing skills aligned with the Lean Six Sigma Body of Knowledge, particularly emphasizing the integration of lean concepts with statistical analysis. By achieving this balance, certified professionals are equipped to navigate projects that require precision, structured methodology, and evidence-based decision-making. Unlike introductory certifications, ICGB validates that individuals can handle projects with moderate complexity while maintaining a clear focus on organizational goals.
Structure of the ICGB Examination
The examination is a comprehensive test of knowledge and application skills. Its structure is designed to assess familiarity with various phases of Lean Six Sigma, particularly the define, measure, analyze, improve, and control framework. Each section of the exam reflects real-world problem-solving situations, requiring candidates to evaluate data, identify inefficiencies, and propose solutions. This structure ensures that certification holders possess a deep and practical understanding of Lean Six Sigma rather than superficial awareness.
The exam typically involves a wide range of question types, including conceptual assessments, numerical analysis, and scenario-based challenges. These are intended to evaluate the candidate’s ability to use Lean Six Sigma tools effectively. Questions are balanced between testing theoretical recall and measuring the ability to apply knowledge in practice. This makes the examination rigorous while ensuring its outcomes are directly relevant to organizational improvement needs.
Knowledge Areas Covered
The ICGB certification requires competence across various domains within Lean Six Sigma. The define phase emphasizes project selection, problem statements, and understanding customer requirements. In the measure phase, candidates must demonstrate proficiency in data collection, process mapping, and statistical evaluation of current performance. The analyze phase focuses on root cause identification, hypothesis testing, and data-driven exploration of potential inefficiencies.
The improve phase centers on designing and implementing solutions, piloting improvements, and evaluating their effectiveness. Finally, the control phase ensures that professionals are capable of maintaining process gains by creating monitoring systems, standard operating procedures, and continuous feedback loops. Together, these knowledge areas ensure that ICGB professionals are not limited to theory but capable of sustaining meaningful organizational change.
Importance of Practical Application
A defining feature of the ICGB certification is its insistence on practical application of learned concepts. Lean Six Sigma tools are designed to bring measurable results, which means that candidates are encouraged to practice their skills in real or simulated projects during preparation. This hands-on approach enhances their ability to connect classroom knowledge with workplace challenges. By applying methods to tangible problems, professionals gain a deeper appreciation of how to reduce inefficiencies, optimize processes, and align outcomes with organizational objectives.
Engaging in practical exercises also helps candidates handle scenario-based questions more effectively during the exam. It sharpens problem-solving skills, improves confidence, and ensures readiness for situations where multiple tools may need to be combined to achieve results. This emphasis on application is what makes the certification highly respected, as it validates both knowledge and competence in action.
Preparation Approaches for the ICGB Exam
Success in the ICGB exam requires a structured and disciplined preparation plan. Breaking the Lean Six Sigma Body of Knowledge into segments allows candidates to master each area without being overwhelmed. Allocating focused time to statistical analysis, project management, and problem-solving tools ensures that no domain is neglected. Study sessions should include both theory and practice, with a strong emphasis on exercises that simulate real-world challenges.
Timed practice tests are invaluable in preparing candidates for the pace of the exam. By working through sample questions under exam conditions, individuals improve their ability to manage time effectively while identifying weaker areas that require additional attention. Reviewing errors after practice sessions helps to clarify misunderstandings and strengthen areas of weakness. A steady and consistent approach to preparation creates familiarity with the exam structure and builds confidence for test day.
Role of Work Experience in Building Competence
Although the exam has no mandatory prerequisites, work experience provides a significant advantage in preparing for certification. Professionals with exposure to process improvement, project management, or operational challenges can directly relate the Lean Six Sigma principles to their daily responsibilities. This contextual understanding enhances retention and application of concepts, making preparation more effective.
For example, individuals who have worked on quality improvement initiatives often understand how customer requirements shape project goals. Those with data analysis experience may find statistical elements of the exam more approachable. By drawing connections between prior work experience and Lean Six Sigma principles, candidates gain a practical foundation that complements theoretical study.
Hybrid Exam Formats and Their Impact
The availability of hybrid exam formats for ICGB has changed the way candidates approach certification. With options that combine traditional in-person testing and modern online proctoring, candidates are provided with greater flexibility. This accessibility reduces barriers to entry, allowing more professionals to pursue certification without being limited by logistical constraints.
The hybrid model also reflects the evolving nature of professional certification, ensuring inclusivity and adaptability. Candidates preparing for the hybrid exam must become familiar with its technical requirements, such as navigating digital interfaces and managing the online proctoring environment. Preparation for the hybrid exam involves not only studying the content but also building confidence in handling the format smoothly, which ensures that technical distractions do not interfere with performance.
Professional Roles After Certification
ICGB-certified professionals play key roles in organizations by leading small-scale improvement initiatives and contributing to larger projects. Their expertise allows them to identify inefficiencies, streamline processes, and reduce waste. In project teams, they often bridge the gap between technical specialists and organizational leaders by translating data-driven insights into actionable strategies.
Their contributions extend beyond immediate project results, as they also help cultivate a culture of continuous improvement. By applying Lean Six Sigma methodologies, they demonstrate the value of evidence-based problem-solving, encouraging colleagues to adopt similar approaches. This ripple effect ensures that improvements are not confined to a single project but gradually influence the broader organizational culture.
Long-Term Value of ICGB Certification
The ICGB certification provides long-term benefits that extend well beyond the immediate recognition of skills. It equips professionals with a structured approach to problem-solving that remains applicable throughout their careers. As industries evolve and organizations face new challenges, the analytical and process-driven mindset fostered by Lean Six Sigma remains relevant.
Certified professionals are better positioned to adapt to changing environments because they have been trained to analyze problems systematically and identify root causes. Their ability to design and sustain improvements ensures that they can provide value in a variety of contexts, from operations to customer service to strategic planning. This adaptability makes the ICGB certification a long-lasting asset in both personal and organizational growth.
Lifelong Learning and Progression
Earning the ICGB certification should be viewed as a milestone rather than a conclusion. Professionals are encouraged to continue applying their skills, seeking new opportunities for practice, and expanding their expertise over time. Each project completed adds depth to their understanding and strengthens their ability to adapt Lean Six Sigma principles to different situations.
While some may choose to pursue further advancement, the ICGB on its own provides a strong platform for career development. Even without additional certifications, the skills gained through ICGB remain valuable and versatile, enabling professionals to take on increasing responsibilities and leadership roles as they gain more experience.
Broader Context of ICGB Certification
The ICGB certification sits at a crucial intersection between professional skill development and organizational efficiency. It focuses on equipping individuals with the ability to analyze existing workflows, identify areas of waste, and implement strategies that create measurable improvements. Unlike introductory credentials, ICGB emphasizes a deeper mastery of Lean Six Sigma principles, ensuring professionals can contribute both as project leaders and as effective members of broader improvement teams. This makes the certification relevant to a wide variety of professional contexts where data-driven decisions and structured problem-solving are valued.
Beyond its technical requirements, the certification embodies a mindset of continuous improvement. By internalizing the principles of Lean Six Sigma, professionals learn to approach challenges methodically, assessing problems at their root and applying systematic solutions. This way of thinking remains useful across industries and job roles, making ICGB not only a certification but also a long-term professional asset.
Exam Rigor and Skill Validation
The ICGB exam is designed to test not only theoretical comprehension but also the ability to apply principles in practical scenarios. Its structured framework ensures that candidates must demonstrate proficiency across all phases of the Lean Six Sigma methodology, from defining project goals to ensuring sustainability of improvements. This rigor validates that those who earn the credential possess genuine competence, not just surface-level familiarity.
The exam’s balance of conceptual and applied questions reflects the real-world expectations placed on certified professionals. They are not only expected to understand terms and tools but also to interpret data, make strategic decisions, and lead project components effectively. This balance makes the exam challenging, but it also enhances the credibility and recognition of the certification in professional settings.
Hybrid Pathways to Certification
One of the defining features of the modern ICGB is the flexibility of hybrid exam options. These formats allow candidates to complete assessments either through traditional in-person centers or via secure online systems. This dual pathway offers accessibility while maintaining the integrity of the testing process. For many professionals, this flexibility is essential in balancing preparation with personal and professional responsibilities.
The hybrid approach also reflects the evolving standards of professional certification. By combining digital technology with established proctoring methods, the certification body ensures that candidates can pursue the credential without unnecessary barriers. However, this requires candidates to be mindful of both the content and the technical environment in which the exam will take place. Preparing for the hybrid format involves ensuring familiarity with digital interfaces and minimizing distractions to perform effectively.
Application of Lean Six Sigma Principles Through ICGB
The certification goes beyond theoretical learning by requiring candidates to demonstrate a clear understanding of how Lean Six Sigma principles can be applied in professional settings. This includes the ability to conduct process mapping, measure performance accurately, and use statistical tools to identify inefficiencies. By mastering these techniques, professionals can take targeted action that addresses organizational challenges with precision.
One of the key aspects of ICGB training is the integration of data analysis with lean methodologies. Candidates are expected to understand how statistical results can guide decision-making while ensuring that improvements are not only effective but sustainable. The ability to balance quantitative analysis with human factors such as teamwork and communication is central to the certification’s value.
Importance of Consistent Preparation
Preparation for the ICGB exam is best approached through a structured and disciplined study plan. Breaking down the Body of Knowledge into smaller sections allows for focused study sessions that progressively build competence. Regular review sessions, practice exercises, and mock exams all contribute to reinforcing learning and identifying areas that need improvement.
Equally important is the ability to apply concepts in practice. Candidates who engage in simulations or participate in real improvement projects during preparation are more likely to retain knowledge and perform confidently during the exam. The balance of theory and practice not only strengthens exam readiness but also ensures that certified professionals can apply their skills immediately in professional contexts.
Professional Opportunities After Certification
Earning the ICGB certification opens up a wide range of professional opportunities. Certified individuals are equipped to take on roles that involve leading smaller improvement projects or serving as essential contributors to larger ones. Their expertise in Lean Six Sigma enables them to analyze workflows, reduce inefficiencies, and contribute to organizational goals in meaningful ways.
In addition to enhancing technical skills, the certification also validates leadership potential. ICGB professionals are often called upon to bridge the gap between strategic decision-making and operational execution. Their ability to translate data-driven insights into actionable outcomes makes them valuable across different levels of an organization.
Integration With Organizational Growth
The significance of ICGB extends beyond individual achievement, as it directly supports organizational objectives. Certified professionals contribute to a culture of continuous improvement by modeling systematic problem-solving approaches. Their projects often result in measurable gains in efficiency, cost savings, or quality improvement, which accumulate over time to strengthen organizational performance.
This integration of personal skill development with organizational outcomes is one of the reasons why ICGB holds lasting value. It represents a synergy where professionals enhance their careers while organizations benefit from more effective and sustainable improvement efforts. The certification becomes not only a personal credential but also a catalyst for broader transformation.
Long-Term Relevance of ICGB
The principles embedded within the ICGB certification retain their relevance regardless of changing industry trends. Lean Six Sigma focuses on efficiency, quality, and data-driven decision-making, all of which remain critical regardless of technological or market shifts. This enduring applicability ensures that certified professionals continue to provide value long after they achieve the credential.
Moreover, the certification fosters a mindset that adapts well to evolving challenges. The ability to analyze problems systematically, design solutions, and sustain improvements ensures that ICGB professionals can navigate uncertainty with confidence. This adaptability makes the certification a durable investment for both individuals and organizations.
Lifelong Growth Beyond Certification
While achieving ICGB represents a significant milestone, it should also be viewed as part of a lifelong learning journey. Professionals are encouraged to continually practice their skills, engage in new projects, and refine their understanding of Lean Six Sigma principles. Each project undertaken deepens their expertise and strengthens their ability to adapt methodologies to different situations.
The Strategic Importance of ICGB Certification
The ICGB certification represents much more than a professional credential. It is a structured acknowledgment of the individual’s ability to apply Lean Six Sigma methodologies in diverse business environments. At its core, it signifies the readiness to contribute to process improvements that deliver tangible results. The focus is not simply on passing an exam but on cultivating a mindset of precision, critical analysis, and sustained improvements. Professionals with ICGB certification are positioned to bring value to their organizations by identifying inefficiencies, analyzing performance gaps, and ensuring processes are aligned with broader goals. This makes the certification both a career asset and a driver of organizational success.
Deep Understanding of the Lean Six Sigma Framework
The ICGB exam ensures candidates have more than just surface familiarity with Lean Six Sigma concepts. They must understand each step of the methodology and its application in real-world situations. The DMAIC cycle—define, measure, analyze, improve, and control—is at the heart of the body of knowledge. Candidates are expected to not only define problems clearly but also measure them with reliable data, analyze the underlying causes, and design practical improvements that can be controlled and sustained. This framework creates consistency, allowing certified professionals to approach any challenge with confidence and clarity.
The exam validates that candidates can apply statistical tools, manage projects, and work effectively in teams. It also demands an appreciation of how process changes affect both immediate outputs and long-term stability. Mastering these interconnected skills ensures ICGB professionals are prepared for leadership in improvement initiatives.
Exam Design and the Candidate Experience
The ICGB exam is intentionally designed to test both theoretical knowledge and applied problem-solving. Its structure ensures that individuals must recall key concepts while also demonstrating their ability to analyze scenarios and select appropriate solutions. This dual focus mirrors professional expectations, where individuals must move seamlessly from understanding frameworks to applying them in practice.
The hybrid examination options available today make the process accessible while maintaining rigor. Candidates may choose testing formats that suit their circumstances, but the standards remain consistent regardless of delivery method. This combination of flexibility and strict evaluation ensures that certification maintains its credibility across professional landscapes.
Preparing for the Exam With Purpose
Preparation for the ICGB exam is best approached through structured learning and disciplined practice. It is not sufficient to memorize definitions or tools. Candidates should strive to understand how the principles of Lean Six Sigma interconnect and how they can be applied to different challenges. Breaking the body of knowledge into smaller sections allows for focused study sessions, but integration across the whole methodology is critical for success.
Practice with sample problems or case studies enhances readiness by simulating the type of critical thinking required during the exam. Engaging with real or hypothetical scenarios helps candidates test their ability to apply concepts under pressure. Developing a rhythm of consistent study sessions, review periods, and practice assessments strengthens confidence and ensures knowledge retention.
Role of ICGB Professionals in Project Environments
Certified professionals are frequently involved in leading smaller projects or supporting larger initiatives under the guidance of Black Belts. Their role involves both technical and interpersonal skills. They must be able to interpret data accurately, create process maps, and use statistical tools to drive insights. At the same time, they need to communicate findings clearly, facilitate team collaboration, and maintain momentum during projects.
ICGB professionals often act as a bridge between strategic leaders and operational teams. They ensure that high-level goals are translated into actionable steps and that those steps are executed consistently. This balance of analytical and collaborative skills is central to their effectiveness in improving organizational processes.
Long-Term Professional Growth Through Certification
While ICGB certification is a significant milestone, it should be viewed as the beginning of a continuous professional journey. Certified individuals are encouraged to apply their knowledge actively and seek opportunities to participate in diverse projects. Each experience reinforces their skills and broadens their perspective on how Lean Six Sigma principles can be adapted to new contexts.
The certification also lays the foundation for professional growth. Even without pursuing further credentials, ICGB professionals can expand their responsibilities by applying their expertise to broader challenges within organizations. The adaptability of Lean Six Sigma methodologies ensures that these skills remain relevant across industries and evolving business landscapes.
Value of Hybrid Certification Models
The hybrid structure of the ICGB exam reflects the modern demand for flexibility without compromising standards. Online proctoring systems and traditional testing centers provide multiple pathways for certification. This adaptability accommodates professionals with different needs, ensuring that logistical barriers do not prevent individuals from pursuing the credential.
At the same time, the hybrid model requires candidates to prepare for more than just content. Technical readiness is equally important. Familiarity with exam platforms, stable environments for test-taking, and disciplined focus during assessments are crucial to success. This added dimension encourages candidates to plan comprehensively, enhancing both their preparation and their performance.
Application of Knowledge Beyond the Exam
The true strength of the ICGB certification lies in its application beyond the exam. Certified professionals bring their expertise to real-world challenges, where they can analyze existing processes and design improvements that reduce inefficiencies, minimize errors, and optimize resources. The certification validates the ability to combine data analysis with structured problem-solving, ensuring that improvements are not just implemented but sustained.
This capacity for ongoing application ensures that the certification remains relevant over time. As organizations face new challenges, ICGB professionals provide the adaptability and structured thinking necessary to address them. Their ability to integrate methodology with practical outcomes makes them valuable assets in any professional environment.
Building a Culture of Continuous Improvement
The presence of ICGB-certified professionals in organizations helps foster a culture where continuous improvement becomes the norm. They bring structured methods for identifying and solving problems, encouraging others to adopt systematic approaches rather than relying on ad hoc solutions. This cultural shift is often as valuable as the immediate project outcomes, as it creates an environment where efficiency, quality, and innovation are ongoing priorities.
By leading projects and demonstrating results, ICGB professionals inspire confidence in Lean Six Sigma methodologies. Their success reinforces the importance of data-driven decision-making and encourages broader adoption of improvement practices across teams. In this way, the certification not only advances individual careers but also strengthens organizational resilience.
Enduring Relevance of ICGB
The ICGB certification remains valuable because the principles of Lean Six Sigma are universally applicable. Regardless of changes in industry, technology, or organizational structures, the need for efficient processes and high-quality outcomes never diminishes. This ensures that certified professionals retain their relevance even as business environments evolve.
The adaptability of Lean Six Sigma methods ensures that ICGB professionals can respond to challenges in different contexts. Whether addressing operational inefficiencies, enhancing service delivery, or driving innovation, their structured approach allows them to provide clarity and results. This enduring relevance makes the certification a lasting investment in professional growth.
The ICGB certification represents a structured pathway to professional competence and organizational impact. It validates the individual’s ability to apply Lean Six Sigma principles rigorously and adapt them to diverse challenges. Through its rigorous exam, flexible pathways, and emphasis on practical application, the certification equips professionals to lead meaningful improvements and contribute to organizational success.
More than just a milestone, ICGB is a foundation for continuous growth. It fosters critical thinking, adaptability, and a mindset of ongoing improvement that remains relevant throughout a professional career. For both individuals and organizations, it is a certification that continues to deliver value long after the exam is complete.
Conclusion
The ICGB certification serves as an essential benchmark in the professional journey of individuals who seek to strengthen their skills in Lean Six Sigma methodologies. It not only validates knowledge but also emphasizes the ability to implement structured problem-solving techniques that can transform processes within an organization. What makes this certification significant is the balance it creates between theory and practice, ensuring that professionals are not just learning concepts but also applying them to achieve measurable improvements. This dual focus allows certified individuals to operate confidently in dynamic environments where efficiency and precision are critical.
One of the most powerful aspects of the ICGB certification lies in its alignment with continuous improvement. By mastering the DMAIC cycle and the broader Lean Six Sigma body of knowledge, professionals gain the tools necessary to analyze, interpret, and optimize processes in a systematic way. This structured methodology allows them to identify the root causes of inefficiencies, develop innovative solutions, and ensure that changes are sustained over time. The emphasis on data-driven decision-making further enhances their credibility, as solutions are based on evidence rather than assumptions. This approach provides long-term benefits not just for the individual but for the entire organization.
In professional practice, ICGB-certified individuals often find themselves in positions where they can influence both operational and strategic outcomes. They might be directly leading smaller improvement projects or supporting larger ones under the guidance of senior professionals. In either role, their expertise ensures that initiatives are carried out with consistency, rigor, and a clear focus on results. Beyond project execution, they also play a key role in fostering a culture of collaboration and shared responsibility, which is vital for sustaining improvements. This cultural impact often becomes one of the most enduring contributions of ICGB-certified professionals.
The flexibility of the hybrid examination format also adds a modern dimension to the certification. Professionals can access the exam through different methods, reducing barriers while maintaining rigorous standards. This adaptability reflects the evolving needs of the workforce and ensures that certification remains accessible without losing its credibility. However, the flexibility of access does not diminish the seriousness of preparation. Candidates must dedicate themselves to understanding not only the technical aspects of Lean Six Sigma but also the practical applications that the exam tests. This preparation phase often becomes a transformative experience, shaping the way individuals approach problems in their daily work.
From a long-term perspective, the ICGB certification opens doors to growth and greater responsibilities. While it is often seen as a mid-level credential, its value extends far beyond that. The principles and skills learned remain relevant across industries, allowing professionals to adapt to shifting demands. This adaptability is especially important in modern contexts where organizations face constant pressure to innovate and remain competitive. The certification therefore functions as a career-long asset, ensuring that professionals remain capable of contributing value in diverse circumstances.
The organizational benefits of ICGB-certified individuals are equally noteworthy. Companies that invest in professionals with this certification gain a workforce skilled in identifying inefficiencies, reducing costs, enhancing quality, and streamlining operations. The structured approach ensures that improvements are not short-lived but integrated into everyday practices. This stability creates a competitive advantage and allows organizations to achieve consistency in performance even when external conditions are unpredictable. The certification thus serves as a bridge between individual professional development and organizational resilience.
Moreover, the ICGB certification contributes to building a culture of continuous improvement within organizations. Certified professionals model structured problem-solving and evidence-based decision-making, inspiring colleagues to adopt similar approaches. Over time, this influence expands, embedding Lean Six Sigma principles into organizational DNA. The result is not only improved processes but also an empowered workforce that approaches challenges with confidence and clarity. This cultural shift often proves more valuable than the immediate outcomes of any single project, as it sustains progress over the long term.
The enduring relevance of the ICGB certification lies in the universality of its principles. Regardless of industry or context, every organization benefits from reducing waste, increasing efficiency, and improving quality. These are not passing trends but fundamental needs that ensure survival and growth. Because of this universality, professionals with ICGB certification remain valuable throughout their careers. Their ability to approach problems methodically and deliver lasting improvements ensures that they can adapt to changing roles, technologies, and business models while continuing to provide value.
In conclusion, the ICGB certification is far more than a credential for passing an exam. It represents the integration of knowledge, application, and mindset that is essential for driving sustainable improvements. Certified individuals embody the balance between analytical skill and practical execution, positioning themselves as key contributors to both organizational success and cultural transformation. For professionals, it serves as a foundation for lifelong growth, while for organizations, it offers a path toward resilience, competitiveness, and excellence. Its value continues to expand as professionals apply its principles across new challenges, proving that the ICGB is not just a step in a career but a cornerstone of professional and organizational progress.
Six Sigma ICGB practice test questions and answers, training course, study guide are uploaded in ETE Files format by real users. Study and Pass ICGB IASSC Certified Lean Six Sigma Green Belt certification exam dumps & practice test questions and answers are to help students.
Purchase ICGB Exam Training Products Individually
Why customers love us?
What do our customers say?
The resources provided for the Six Sigma certification exam were exceptional. The exam dumps and video courses offered clear and concise explanations of each topic. I felt thoroughly prepared for the ICGB test and passed with ease.
Studying for the Six Sigma certification exam was a breeze with the comprehensive materials from this site. The detailed study guides and accurate exam dumps helped me understand every concept. I aced the ICGB exam on my first try!
I was impressed with the quality of the ICGB preparation materials for the Six Sigma certification exam. The video courses were engaging, and the study guides covered all the essential topics. These resources made a significant difference in my study routine and overall performance. I went into the exam feeling confident and well-prepared.
The ICGB materials for the Six Sigma certification exam were invaluable. They provided detailed, concise explanations for each topic, helping me grasp the entire syllabus. After studying with these resources, I was able to tackle the final test questions confidently and successfully.
Thanks to the comprehensive study guides and video courses, I aced the ICGB exam. The exam dumps were spot on and helped me understand the types of questions to expect. The certification exam was much less intimidating thanks to their excellent prep materials. So, I highly recommend their services for anyone preparing for this certification exam.
Achieving my Six Sigma certification was a seamless experience. The detailed study guide and practice questions ensured I was fully prepared for ICGB. The customer support was responsive and helpful throughout my journey. Highly recommend their services for anyone preparing for their certification test.
I couldn't be happier with my certification results! The study materials were comprehensive and easy to understand, making my preparation for the ICGB stress-free. Using these resources, I was able to pass my exam on the first attempt. They are a must-have for anyone serious about advancing their career.
The practice exams were incredibly helpful in familiarizing me with the actual test format. I felt confident and well-prepared going into my ICGB certification exam. The support and guidance provided were top-notch. I couldn't have obtained my Six Sigma certification without these amazing tools!
The materials provided for the ICGB were comprehensive and very well-structured. The practice tests were particularly useful in building my confidence and understanding the exam format. After using these materials, I felt well-prepared and was able to solve all the questions on the final test with ease. Passing the certification exam was a huge relief! I feel much more competent in my role. Thank you!
The certification prep was excellent. The content was up-to-date and aligned perfectly with the exam requirements. I appreciated the clear explanations and real-world examples that made complex topics easier to grasp. I passed ICGB successfully. It was a game-changer for my career in IT!


