- Home
- Microsoft Certifications
- PL-300 Microsoft Power BI Data Analyst Dumps
Pass Microsoft Power BI PL-300 Exam in First Attempt Guaranteed!
Get 100% Latest Exam Questions, Accurate & Verified Answers to Pass the Actual Exam!
30 Days Free Updates, Instant Download!

PL-300 Premium Bundle
- Premium File 397 Questions & Answers. Last update: Jun 28, 2026
- Training Course 266 Video Lectures
- Study Guide 452 Pages
Last Week Results!

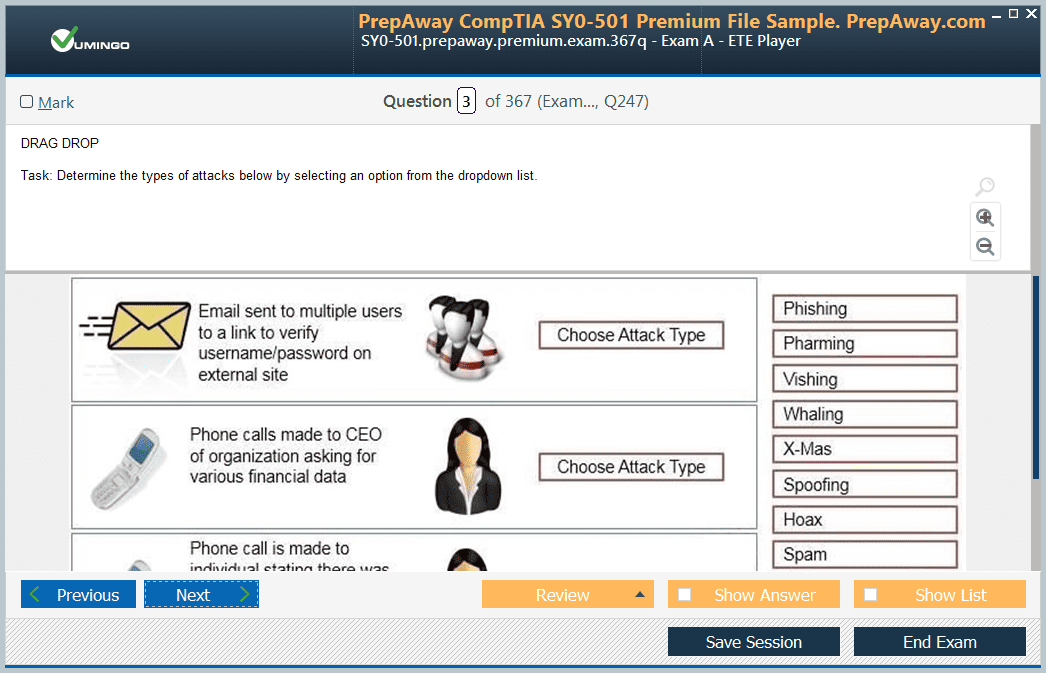
Includes question types found on the actual exam such as drag and drop, simulation, type-in and fill-in-the-blank.
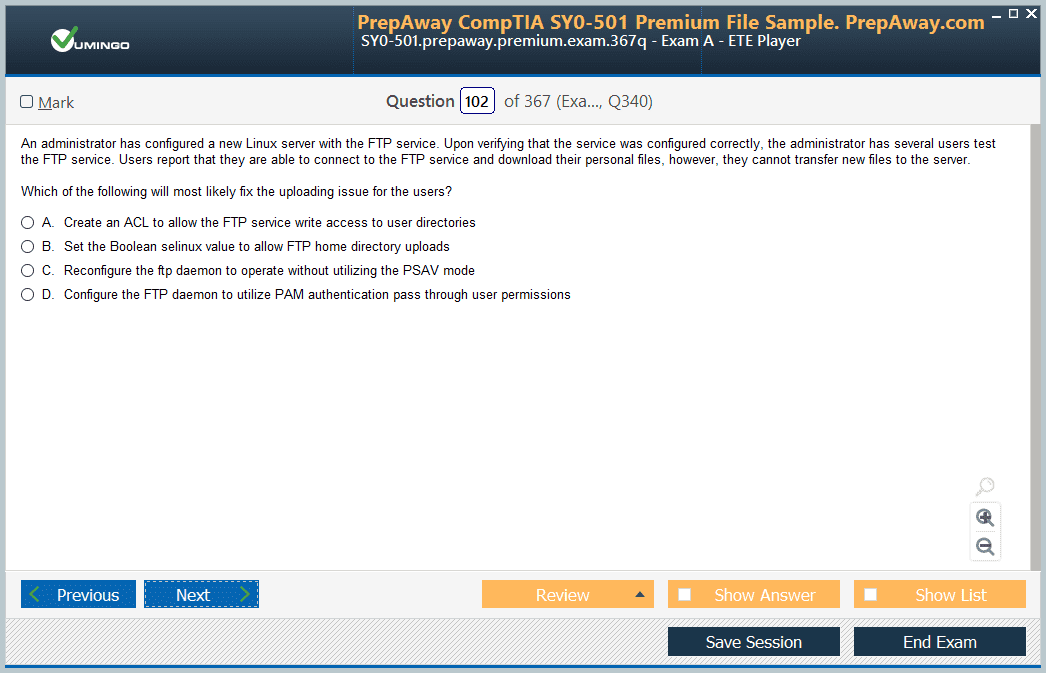
Based on real-life scenarios similar to those encountered in the exam, allowing you to learn by working with real equipment.

Developed by IT experts who have passed the exam in the past. Covers in-depth knowledge required for exam preparation.
All Microsoft Power BI PL-300 certification exam dumps, study guide, training courses are Prepared by industry experts. PrepAway's ETE files povide the PL-300 Microsoft Power BI Data Analyst practice test questions and answers & exam dumps, study guide and training courses help you study and pass hassle-free!
Your All-in-One Playbook for Passing the PL-300 Power BI Exam
The PL-300 exam, officially titled Microsoft Power BI Data Analyst, is a professional-level certification that tests your ability to work with data in meaningful and practical ways using Microsoft's business intelligence platform. Unlike entry-level certifications that reward broad familiarity with concepts, the PL-300 requires you to demonstrate hands-on competence across the entire analytics workflow, from connecting to data sources and shaping raw data to building sophisticated reports and deploying them within an organization. Microsoft designed this exam for professionals who use Power BI regularly in their work, and that context matters because the questions reflect real scenarios rather than abstract theory.
What separates successful candidates from those who fall short is not simply the amount of time spent studying, but the quality and direction of that preparation. Many people who fail the PL-300 on their first attempt do so because they treated it like a conceptual test rather than a skills-based one. The exam expects you to know not just what Power BI can do, but precisely how to accomplish specific tasks within the application. That distinction changes how you should approach every hour of your preparation and why a strategy built around doing rather than only reading will consistently outperform passive study methods.
Getting Familiar With the Official Exam Blueprint
Before spending a single hour on study materials, the very first step every candidate should take is downloading and reading the official exam skills outline published by Microsoft. This document is publicly available on the Microsoft certification page and breaks down every topic area covered in the exam along with the approximate percentage of questions dedicated to each domain. The PL-300 currently organizes its content across four primary areas: preparing the data, modeling the data, visualizing and analyzing the data, and deploying and maintaining assets. Each area carries a different weight, and knowing those weights allows you to allocate your preparation time accordingly rather than treating every topic as equally important.
The skills outline is also updated periodically to reflect changes in the Power BI platform, so always verify that you are reading the most current version before you begin studying. Microsoft has a habit of adding new features to Power BI at a rapid pace, and exam content tends to follow those updates after a short lag. Candidates who studied from outdated materials have found themselves confronted with questions about features they never encountered during preparation. Making the official blueprint your foundational reference document keeps you anchored to what will actually appear on exam day rather than what appeared on someone else's exam six months ago.
Building Your Data Preparation Skills From the Ground Up
A substantial portion of the PL-300 is dedicated to data preparation, and Power Query is the primary tool you need to command for this section. Power Query, which operates within both Power BI Desktop and Excel, allows you to connect to a wide variety of data sources, transform raw data into a usable format, and load that data into your model in a clean and structured state. The exam tests your knowledge of common transformations like merging queries, appending tables, unpivoting columns, splitting fields, replacing values, and applying conditional logic. You should be able to perform each of these operations confidently and understand the scenarios in which each one is most appropriate.
Beyond individual transformations, the exam also tests your understanding of query folding, which is the process by which Power Query pushes transformation steps back to the source database rather than processing them locally. Candidates who understand when query folding occurs and when it breaks often find this knowledge appearing in performance-related questions throughout the exam. Additionally, the concept of data types is critical in this section because incorrect data types at the query level cascade into modeling errors, DAX calculation failures, and visual display problems downstream. Treating data preparation as merely a preliminary step is a strategic mistake; it is one of the most technically demanding sections of the entire exam.
Achieving Fluency in the Data Modeling Domain
If data preparation is the foundation of a Power BI solution, the data model is its architecture, and the PL-300 tests your ability to design that architecture intelligently. Candidates need to demonstrate a clear understanding of star schema design, which involves separating fact tables containing transactional data from dimension tables containing descriptive attributes. Star schemas are not just a best practice preference; they are the recommended approach within Power BI because they optimize DAX calculation performance and simplify relationship management. Examiners expect you to recognize when a data model follows this pattern and when it does not, and to identify the problems that arise from poor schema design.
Relationships between tables are another critical area within the modeling domain. You need to understand the difference between active and inactive relationships, know how to activate an inactive relationship within a DAX measure using the USERELATIONSHIP function, and recognize scenarios where bidirectional cross-filtering is appropriate versus where it introduces ambiguity or performance issues. Row-level security is also tested in this section and requires you to know how to define roles, write DAX filter expressions that restrict data access by user, and validate those roles before publishing a report. Each of these topics is practical and implementation-focused, which means the best way to learn them is by building actual models in Power BI Desktop and testing different configurations.
Developing a Serious Relationship With DAX
DAX, which stands for Data Analysis Expressions, is the formula language used within Power BI to create calculated columns, measures, and calculated tables. It is also the topic that most candidates identify as the most challenging aspect of the PL-300 preparation process, and for good reason. DAX looks deceptively similar to Excel formulas at first glance, but it operates on fundamentally different principles related to filter context and row context. Candidates who approach DAX as if it were simply a more powerful version of Excel formulas consistently struggle with questions that require them to trace how context flows through a calculation.
The functions you absolutely must know for the exam include CALCULATE, which modifies the filter context of a calculation and is arguably the most important function in the entire language. You also need to be comfortable with time intelligence functions like TOTALYTD, SAMEPERIODLASTYEAR, DATEADD, and DATESYTD, as time-based comparisons appear consistently across exam questions. Iterator functions like SUMX, AVERAGEX, and COUNTX deserve dedicated attention because they are frequently misunderstood and confused with their simpler aggregation counterparts. RELATED and RELATEDTABLE allow you to work across table relationships in calculated columns and measures respectively, and ALL, ALLEXCEPT, and FILTER are essential for manipulating context in advanced calculations. Build a personal library of practice problems for each of these functions and work through them until the logic feels second nature.
Bringing Reports to Life With Thoughtful Visualization
The visualization section of the PL-300 covers your ability to select the right visual for a given scenario, configure it correctly, and apply formatting choices that make the report both readable and actionable. Microsoft tests not just technical configuration but also analytical judgment, so you may be asked which visual type is most appropriate for comparing values across categories, tracking trends over time, showing proportional relationships, or displaying geographic distributions. Knowing the strengths and limitations of bar charts, line charts, scatter plots, treemaps, maps, matrix visuals, and cards is essential, as is understanding when a custom visual from the AppSource marketplace might be more appropriate than a built-in option.
Beyond individual visuals, the exam tests your knowledge of report-level features like drill-through pages, which allow users to right-click a data point and navigate to a detail page filtered by that selection. Bookmarks and buttons enable interactive storytelling within a report, and the exam expects you to know how to configure them to show or hide visuals, navigate between pages, and capture specific filter states. Conditional formatting, which applies color, icons, or data bars to visuals based on underlying values, also appears in this section and requires hands-on familiarity to answer correctly under time pressure. The key insight for this entire domain is that Power BI reports are not static documents; they are interactive experiences, and the exam reflects that reality.
Applying Analytical Thinking Beyond Basic Reporting
The PL-300 goes beyond asking whether you can build a report and tests whether you can use Power BI as a genuine analytical tool. This includes features like the Q&A visual, which allows users to ask questions in natural language and receive visual answers, and the AI-powered visuals like Key Influencers and Decomposition Tree, which help users identify patterns and break down metrics by contributing factors. These features are increasingly prominent in exam questions because they represent Microsoft's push toward making data analysis accessible to business users who may not have traditional analytics training.
Statistical concepts also appear in this section, including the use of reference lines, error bars, forecasting on line charts, and clustering on scatter plots. These are not deeply mathematical topics within the context of the exam, but they do require you to understand what each feature does and when it is appropriate to use it. The ability to add a forecast line to a time series chart, for instance, requires you to know where to find the option in the analytics pane, how to configure confidence intervals, and how to interpret the result for a business audience. Pairing your technical knowledge of where to click with a clear sense of the analytical purpose behind each feature is what the highest-scoring candidates consistently demonstrate.
Connecting Power BI to External Data Sources Confidently
One of the most practical skills tested in the PL-300 is the ability to connect Power BI to a wide variety of data sources and choose the appropriate storage mode for each connection. The three primary storage modes are import, DirectQuery, and live connection, and each has distinct implications for performance, data freshness, and report behavior. Import mode loads data into Power BI's in-memory engine, which delivers fast query performance but means the data is only as current as the last refresh. DirectQuery sends every visual interaction as a live query to the source database, which ensures real-time data but can introduce latency depending on the database's performance. Live connection is used specifically with Analysis Services or Power BI datasets and restricts certain modeling capabilities within the report.
The exam tests your ability to recognize which storage mode is appropriate based on a described scenario and to understand the trade-offs involved in each choice. You also need to be familiar with composite models, which allow you to combine import and DirectQuery tables within a single model, and aggregations, which improve DirectQuery performance by pre-computing summary data that can satisfy common queries without hitting the underlying database. Gateway configuration is another topic in this area, covering how on-premises data sources are made accessible to the Power BI service through the on-premises data gateway. Understanding the difference between the standard and personal gateway modes and knowing when each is appropriate will serve you well on exam day.
Learning the Power BI Service Inside and Out
Many candidates spend the majority of their preparation time in Power BI Desktop and arrive at the exam underprepared for questions about the Power BI service, which is the cloud-based platform where reports are published, shared, and managed. The service introduces a range of concepts that do not exist in the desktop application, including workspaces, apps, and the distinction between different license types. You need to know how to publish reports from Desktop to the service, how to organize content within workspaces, and how to create and distribute Power BI apps to end users who need access to reports without the ability to edit them.
Scheduled refresh is a critical topic within the service, covering how you configure automatic data refresh for imported datasets, set refresh frequency, and manage credentials for data source connections. Alerts and subscriptions allow users to receive notifications when data crosses a specified threshold or to receive regular email snapshots of reports, and the exam tests your knowledge of how to configure both. Endorsement features like promoted and certified dataset badges are also covered, as they reflect Microsoft's emphasis on data governance and the need for organizations to signal which datasets are trustworthy and officially maintained. Time spent clicking through the Power BI service and actually configuring these features is irreplaceable preparation for this portion of the exam.
Practicing With Real Exam Simulations and Honest Self-Assessment
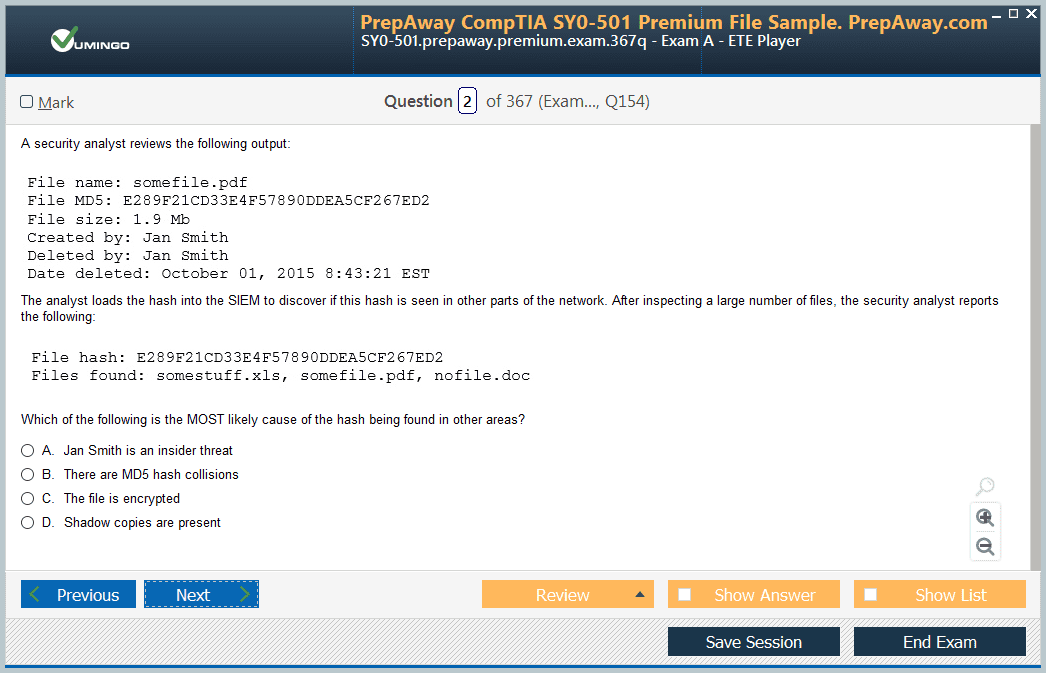
Practice exams are among the most effective tools available for PL-300 preparation, but only when used correctly. The goal of a practice exam is not to accumulate a high score that makes you feel ready; it is to expose the specific areas where your knowledge has gaps so you can return to those topics with focused attention. Take your first practice exam before you have completed all your studying and treat the results as a diagnostic rather than a performance evaluation. The questions you get wrong will tell you exactly where to direct your energy in the remaining preparation time.
Several reputable platforms offer PL-300 practice questions, including MeasureUp, which is Microsoft's official practice test provider, as well as Whizlabs, ExamTopics, and various offerings on Udemy from instructors who specialize in Power BI certification preparation. When reviewing incorrect answers, do not simply read the explanation and move on. Go back to Power BI Desktop or the service and replicate the scenario described in the question so that the correct answer becomes something you have experienced rather than something you have merely read. This active reinforcement approach dramatically improves retention and is the reason candidates who combine practice questions with hands-on application consistently outperform those who rely on question banks alone.
Managing Exam Day With Confidence and Precision
The PL-300 exam is delivered through Pearson VUE and can be taken either at a certified testing center or via online proctoring from a suitable location. The exam consists of between 40 and 60 questions and must be completed within 100 minutes, which translates to roughly two minutes per question on average. Some questions will require considerably less time, while scenario-based case study questions may require more careful reading and analysis. Developing a sense of your pacing during practice exams is essential so that you arrive on exam day with a reliable internal sense of how much time you can afford to spend on any single question.
On the exam itself, flag questions that are causing you to hesitate and return to them after you have worked through the questions you can answer more confidently. This strategy ensures you do not sacrifice easy points by spending too long on difficult ones. Pay careful attention to the precise wording of each question because the PL-300 often includes options that are partially correct, and the distinction between the best answer and a merely acceptable one can hinge on a single word. Read every answer option fully before selecting one, even when you feel confident about your initial instinct. Careful reading under time pressure is a skill that improves with deliberate practice, and building that habit during your preparation will pay dividends on the actual exam day.
Conclusion
The path to passing the PL-300 Power BI exam is demanding, but it is also one of the most professionally rewarding journeys you can undertake if you are serious about a career in data analytics. What this playbook has outlined is not a collection of shortcuts or memorization tricks but a genuine strategy built around the same principles that drive success in the actual job: understanding the data deeply, modeling it intelligently, presenting it clearly, and managing it responsibly within an organizational context. Every section of the exam corresponds to a real skill that practicing Power BI analysts use regularly, which means the effort you invest in preparation is never wasted even if you use it before you ever sit the exam.
Start your preparation by anchoring everything to the official Microsoft exam skills outline and resist the temptation to rely on outdated study guides or secondhand accounts of what the exam covers. Spend significant time inside Power BI Desktop working through data preparation and modeling scenarios that challenge your current abilities. Build your DAX knowledge systematically, beginning with the foundational functions and progressing to context manipulation and time intelligence before you attempt complex multi-measure calculations. Give the Power BI service the same level of attention you give the desktop application, because deployment, governance, and sharing are not secondary concerns in the exam or in professional practice.
Use practice exams honestly, treating wrong answers as gifts that reveal exactly where more work is needed rather than as failures to be rationalized away. Supplement your self-study with structured courses from reputable instructors who have a track record with Power BI specifically, and look for courses that include hands-on labs rather than only video instruction. Join online communities like the Power BI community forums, relevant subreddits, and LinkedIn groups where active practitioners discuss real problems, because exposure to how professionals actually use the tool adds a layer of contextual understanding that no textbook can replicate.
When you finally sit the exam, carry into that room not just your technical knowledge but the confidence that comes from genuine preparation. The PL-300 is not a test designed to trick you or to reward rote memorization; it is designed to verify that you can function effectively as a Power BI data analyst in a real organizational setting. Candidates who prepare with that framing in mind, who study as if they are learning to do a job rather than pass a test, consistently find that the exam reflects the work they have put in. The credential that follows is more than a line on a resume; it is a verified signal to every employer who sees it that you possess the skills to turn raw data into insight that organizations can act on, and in a world that is increasingly driven by data, that signal carries genuine and lasting professional value.
Microsoft Power BI PL-300 practice test questions and answers, training course, study guide are uploaded in ETE Files format by real users. Study and Pass PL-300 Microsoft Power BI Data Analyst certification exam dumps & practice test questions and answers are to help students.
Exam Comments * The most recent comment are on top
- AZ-104 - Microsoft Azure Administrator
- AZ-305 - Designing Microsoft Azure Infrastructure Solutions
- DP-700 - Implementing Data Engineering Solutions Using Microsoft Fabric
- AB-100 - Agentic AI Business Solutions Architect
- SC-300 - Microsoft Identity and Access Administrator
- MD-102 - Endpoint Administrator
- PL-300 - Microsoft Power BI Data Analyst
- AB-900 - Microsoft 365 Copilot and Agent Administration Fundamentals
- MS-102 - Microsoft 365 Administrator
- SC-200 - Microsoft Security Operations Analyst
- AI-900 - Microsoft Azure AI Fundamentals
- AZ-900 - Microsoft Azure Fundamentals
- SC-401 - Administering Information Security in Microsoft 365
- AZ-700 - Designing and Implementing Microsoft Azure Networking Solutions
- DP-600 - Implementing Analytics Solutions Using Microsoft Fabric
- AI-102 - Designing and Implementing a Microsoft Azure AI Solution
- AI-103 - Developing AI Apps and Agents on Azure
- AZ-500 - Microsoft Azure Security Technologies
- SC-100 - Microsoft Cybersecurity Architect
- AB-730 - AI Business Professional
- AB-731 - AI Transformation Leader
- GH-300 - GitHub Copilot
- PL-400 - Microsoft Power Platform Developer
- AZ-204 - Developing Solutions for Microsoft Azure
- SC-900 - Microsoft Security, Compliance, and Identity Fundamentals
- AZ-140 - Configuring and Operating Microsoft Azure Virtual Desktop
- AZ-400 - Designing and Implementing Microsoft DevOps Solutions
- DP-300 - Administering Microsoft Azure SQL Solutions
- AZ-801 - Configuring Windows Server Hybrid Advanced Services
- MS-700 - Managing Microsoft Teams
- PL-600 - Microsoft Power Platform Solution Architect
- AZ-800 - Administering Windows Server Hybrid Core Infrastructure
- MB-800 - Microsoft Dynamics 365 Business Central Functional Consultant
- PL-200 - Microsoft Power Platform Functional Consultant
- AI-300 - Operationalizing Machine Learning and Generative AI Solutions
- PL-900 - Microsoft Power Platform Fundamentals
- MB-310 - Microsoft Dynamics 365 Finance Functional Consultant
- MB-330 - Microsoft Dynamics 365 Supply Chain Management
- AI-901 - Microsoft Azure AI Fundamentals
- SC-500 - Implementing End-to-End Security Controls for Cloud and AI Workloads
- DP-900 - Microsoft Azure Data Fundamentals
- MB-820 - Microsoft Dynamics 365 Business Central Developer
- MB-280 - Microsoft Dynamics 365 Customer Experience Analyst
- MB-230 - Microsoft Dynamics 365 Customer Service Functional Consultant
- MS-721 - Collaboration Communications Systems Engineer
- DP-800 - Developing AI-Enabled Database Solutions
- GH-200 - GitHub Actions
- MB-700 - Microsoft Dynamics 365: Finance and Operations Apps Solution Architect
- MB-500 - Microsoft Dynamics 365: Finance and Operations Apps Developer
- DP-420 - Designing and Implementing Cloud-Native Applications Using Microsoft Azure Cosmos DB
- DP-750 - Implementing Data Engineering Solutions Using Azure Databricks
- DP-100 - Designing and Implementing a Data Science Solution on Azure
- GH-900 - GitHub Foundations
- PL-500 - Microsoft Power Automate RPA Developer
- MB-335 - Microsoft Dynamics 365 Supply Chain Management Functional Consultant Expert
- GH-100 - GitHub Administration
- GH-500 - GitHub Advanced Security
- MS-900 - Microsoft 365 Fundamentals
- AZ-120 - Planning and Administering Microsoft Azure for SAP Workloads
- SC-400 - Microsoft Information Protection Administrator
- MB-240 - Microsoft Dynamics 365 for Field Service
- DP-203 - Data Engineering on Microsoft Azure
- 62-193 - Technology Literacy for Educators
- MO-200 - Microsoft Excel (Excel and Excel 2019)
- MB-910 - Microsoft Dynamics 365 Fundamentals Customer Engagement Apps (CRM)
- 98-367 - Security Fundamentals
- MO-400 - Microsoft Outlook (Outlook and Outlook 2019)
- MS-203 - Microsoft 365 Messaging
Purchase PL-300 Exam Training Products Individually
Why customers love us?
What do our customers say?
The resources provided for the Microsoft certification exam were exceptional. The exam dumps and video courses offered clear and concise explanations of each topic. I felt thoroughly prepared for the PL-300 test and passed with ease.
Studying for the Microsoft certification exam was a breeze with the comprehensive materials from this site. The detailed study guides and accurate exam dumps helped me understand every concept. I aced the PL-300 exam on my first try!
I was impressed with the quality of the PL-300 preparation materials for the Microsoft certification exam. The video courses were engaging, and the study guides covered all the essential topics. These resources made a significant difference in my study routine and overall performance. I went into the exam feeling confident and well-prepared.
The PL-300 materials for the Microsoft certification exam were invaluable. They provided detailed, concise explanations for each topic, helping me grasp the entire syllabus. After studying with these resources, I was able to tackle the final test questions confidently and successfully.
Thanks to the comprehensive study guides and video courses, I aced the PL-300 exam. The exam dumps were spot on and helped me understand the types of questions to expect. The certification exam was much less intimidating thanks to their excellent prep materials. So, I highly recommend their services for anyone preparing for this certification exam.
Achieving my Microsoft certification was a seamless experience. The detailed study guide and practice questions ensured I was fully prepared for PL-300. The customer support was responsive and helpful throughout my journey. Highly recommend their services for anyone preparing for their certification test.
I couldn't be happier with my certification results! The study materials were comprehensive and easy to understand, making my preparation for the PL-300 stress-free. Using these resources, I was able to pass my exam on the first attempt. They are a must-have for anyone serious about advancing their career.
The practice exams were incredibly helpful in familiarizing me with the actual test format. I felt confident and well-prepared going into my PL-300 certification exam. The support and guidance provided were top-notch. I couldn't have obtained my Microsoft certification without these amazing tools!
The materials provided for the PL-300 were comprehensive and very well-structured. The practice tests were particularly useful in building my confidence and understanding the exam format. After using these materials, I felt well-prepared and was able to solve all the questions on the final test with ease. Passing the certification exam was a huge relief! I feel much more competent in my role. Thank you!
The certification prep was excellent. The content was up-to-date and aligned perfectly with the exam requirements. I appreciated the clear explanations and real-world examples that made complex topics easier to grasp. I passed PL-300 successfully. It was a game-changer for my career in IT!


Thanks!