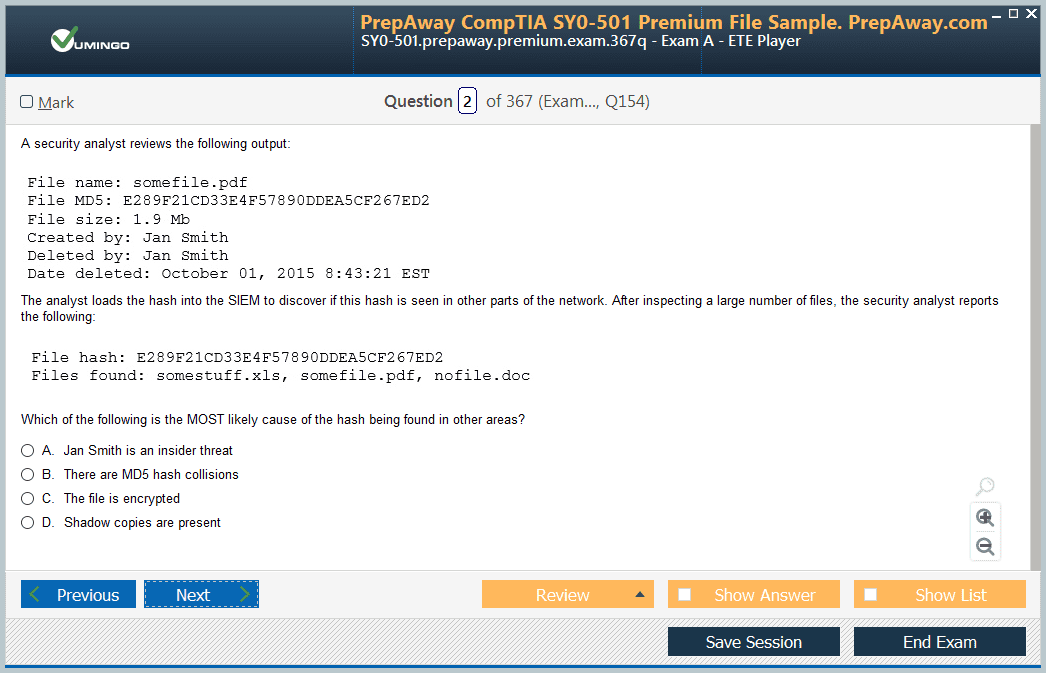
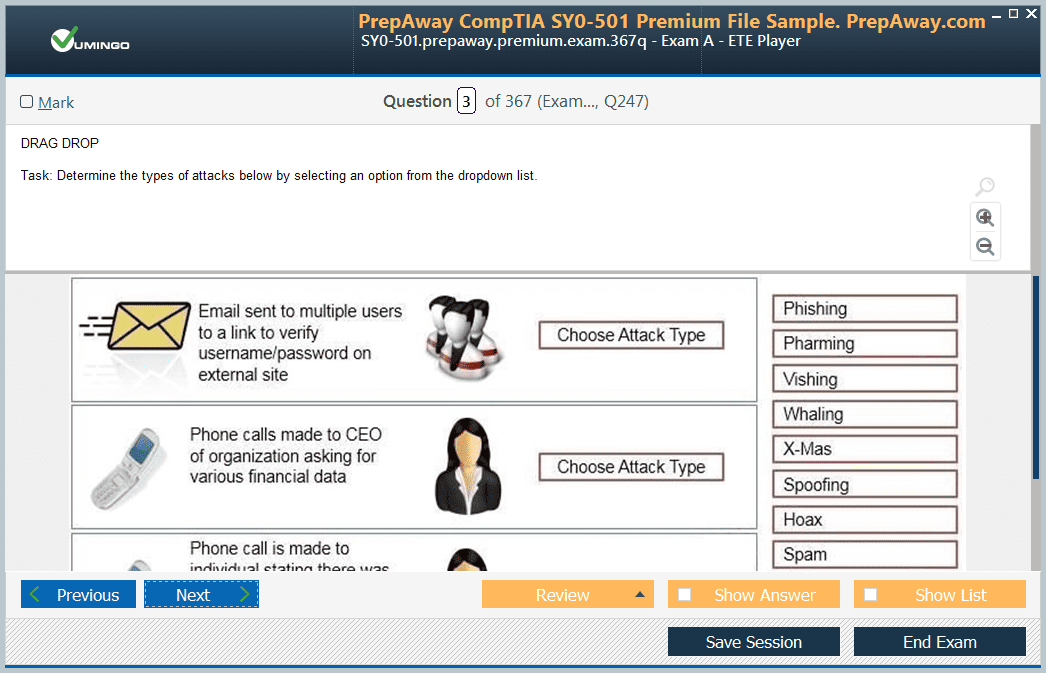
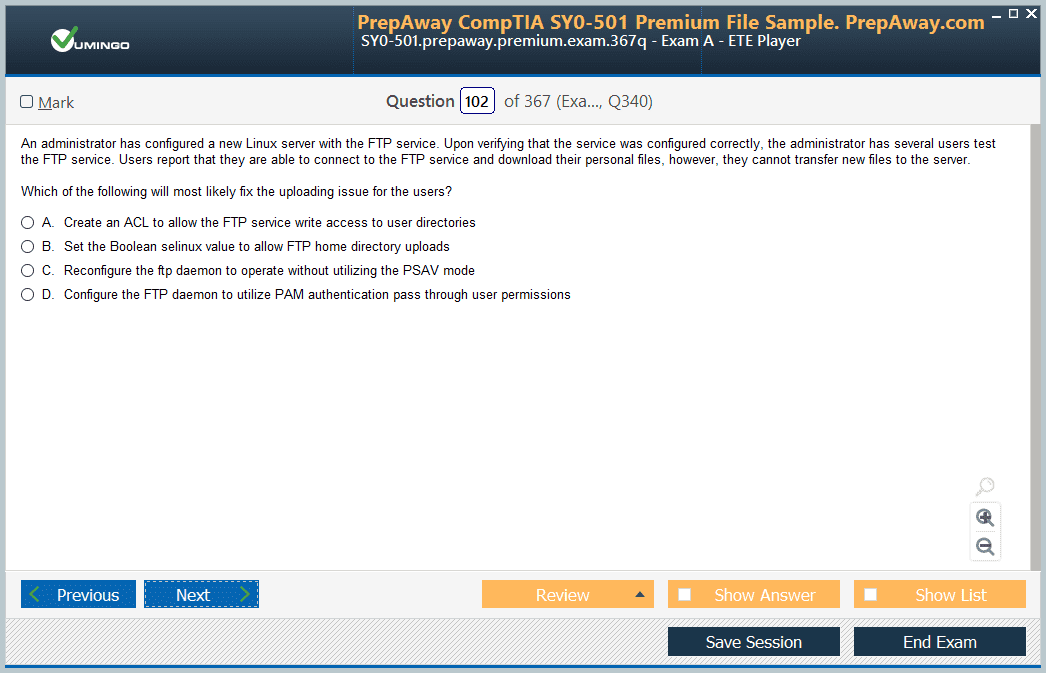
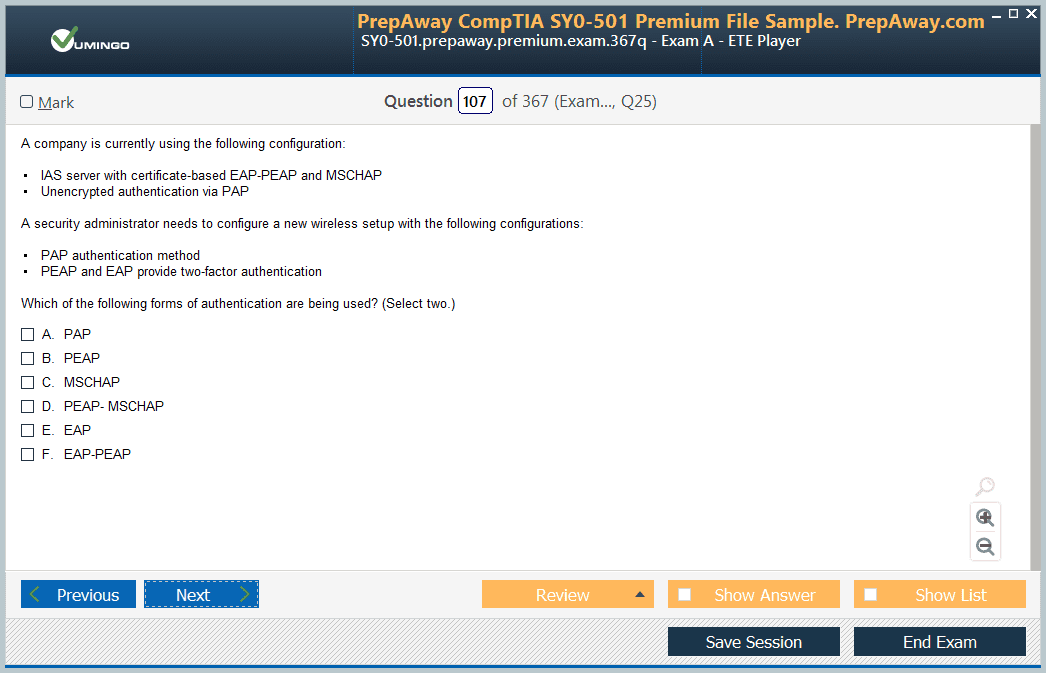
- Home
- Microsoft Certifications
- MO-201 Microsoft Excel Expert (Excel and Excel 2019) Dumps
Pass Microsoft Excel Expert MO-201 Exam in First Attempt Guaranteed!
Get 100% Latest Exam Questions, Accurate & Verified Answers to Pass the Actual Exam!
30 Days Free Updates, Instant Download!


MO-201 Premium Bundle
- Premium File 24 Questions & Answers. Last update: Jul 28, 2026
- Training Course 92 Video Lectures
- Study Guide 204 Pages
Last Week Results!

Includes question types found on the actual exam such as drag and drop, simulation, type-in and fill-in-the-blank.

Based on real-life scenarios similar to those encountered in the exam, allowing you to learn by working with real equipment.

Developed by IT experts who have passed the exam in the past. Covers in-depth knowledge required for exam preparation.
All Microsoft Excel Expert MO-201 certification exam dumps, study guide, training courses are Prepared by industry experts. PrepAway's ETE files povide the MO-201 Microsoft Excel Expert (Excel and Excel 2019) practice test questions and answers & exam dumps, study guide and training courses help you study and pass hassle-free!
Excel Mastery for MO-201: Tips, Tricks, and Practice
The advanced Excel exam is designed to assess a candidate’s ability to operate at an expert level within Excel, going beyond basic and intermediate functionalities. This exam evaluates a wide range of skills including data management, advanced formula construction, automation through macros, and the creation of complex visualizations. Candidates are tested on their capability to handle real-world spreadsheet scenarios efficiently, ensuring accuracy, consistency, and the ability to manage large datasets effectively. It is aimed at professionals who need to demonstrate a thorough understanding of Excel’s most sophisticated tools and features in practical, time-constrained conditions
Exam Structure and Format
The exam consists of several practical projects, each containing multiple tasks that simulate real-world applications of Excel. These tasks are designed to test a candidate’s ability to integrate multiple skills in a single project, reflecting how Excel is used in professional environments. The time limit requires candidates to work efficiently, prioritize tasks, and manage multiple steps in a structured manner. Each project can include tasks related to advanced formulas, data analysis, automation through macros, and visual representation of data through charts and pivot tables. The emphasis is on applying knowledge rather than recalling theoretical information
Key Skills Assessed
Candidates are expected to manage workbooks comprehensively, including configuring settings for collaboration, protecting worksheets, and optimizing structures for efficient navigation and usability. Managing data is a core component of the exam, with tasks involving the application of advanced formatting, data validation, conditional formatting, and filtering techniques. These skills ensure that the data is both accurate and accessible for analysis. The exam also evaluates the ability to perform complex calculations using logical, lookup, and data analysis functions, as well as advanced date and time calculations
Advanced Formulas and Functions
One of the most critical areas of the exam is the creation and manipulation of advanced formulas. Candidates must demonstrate proficiency in using logical functions, lookup functions, and data analysis tools to solve practical problems. This includes constructing formulas that combine multiple functions, troubleshooting errors, and ensuring that calculations remain dynamic and adaptable to changing datasets. Candidates must also apply formulas efficiently within large spreadsheets and understand how to structure references, including absolute and relative referencing, to ensure consistent results across a workbook
Automation Using Macros
The exam requires knowledge of macros, including recording, naming, modifying, and applying them across workbooks. Automation through macros is a key component because it allows repetitive tasks to be performed efficiently. Candidates must be able to create macros that perform specific actions, test their functionality, and implement them within different spreadsheet scenarios. This demonstrates both technical proficiency and the ability to optimize workflows, which is essential for professional-level Excel users
Data Visualization and Analysis
Visual representation of data is another critical skill area. Candidates must be capable of creating advanced charts, pivot tables, and pivot charts that effectively communicate data insights. The exam tests the ability to customize these visual tools to highlight trends, compare metrics, and summarize complex information succinctly. This requires understanding both the technical aspects of Excel charting and the analytical reasoning necessary to present data meaningfully. Candidates must also demonstrate the ability to modify and manipulate visualizations to adapt to different types of datasets and reporting requirements
Time Management and Efficiency
Time management is a significant factor in the exam, as candidates must complete multiple complex tasks within a limited time. Efficient navigation of Excel, use of keyboard shortcuts, and knowledge of built-in tools are critical for completing the exam successfully. Practicing under timed conditions is essential to develop the ability to prioritize tasks, avoid unnecessary steps, and maintain accuracy while working quickly. The exam rewards not only technical expertise but also the ability to manage workload under pressure
Preparing for the Exam
Preparation for the exam involves systematic practice and review of all advanced Excel features. Candidates should identify areas where they are less confident and focus on improving those skills. Developing a structured study approach that covers workbook management, data handling, formulas, macros, and visualization is essential. Practicing real-world tasks, simulating exam conditions, and reviewing common pitfalls can significantly improve performance. Familiarity with the types of projects and tasks likely to appear on the exam allows candidates to approach each scenario with confidence and efficiency
Integrating Skills in Practical Scenarios
The exam emphasizes the integration of multiple skills in practical applications. Tasks are designed to mimic workplace scenarios where different Excel functions must be used together to achieve a solution. For example, candidates may need to manage data integrity while applying formulas, creating charts, and automating repetitive tasks within a single project. Success depends on the ability to apply knowledge flexibly and adapt to varying requirements, demonstrating both technical expertise and problem-solving ability
Benefits of Certification
Achieving certification signifies a high level of proficiency in Excel and provides recognition of expert-level skills. It indicates the ability to manage, analyze, and present data in sophisticated ways, making candidates valuable for professional roles that require advanced data handling and reporting. Certification reflects mastery of complex Excel features, efficiency in workflow management, and the capability to implement automated solutions. It also demonstrates readiness to apply advanced tools in real-world contexts, highlighting both technical and analytical competence
Developing Proficiency Through Practice
The advanced Excel exam rewards practical experience. Regular use of Excel in challenging scenarios helps reinforce learning and develop confidence. Practicing with complex datasets, creating dynamic reports, and experimenting with automation and formulas are essential steps in preparation. Candidates should focus on understanding the rationale behind each feature and function, exploring multiple ways to achieve results, and ensuring accuracy and efficiency in their work. Continuous practice builds familiarity with Excel’s advanced capabilities, which is crucial for success in the exam
Strategies for Exam Readiness
Effective preparation involves combining theoretical knowledge with hands-on application. Candidates should review all advanced Excel functionalities systematically, practice integrating multiple skills in single projects, and simulate exam conditions to build speed and accuracy. Identifying weaknesses early, practicing high-pressure tasks, and developing consistent workflows are key strategies. Additionally, understanding how different functions and features interact allows for more effective problem-solving, as tasks on the exam often require applying several tools in combination
Understanding Task Complexity
The exam presents tasks of varying complexity, each requiring a thoughtful approach and clear understanding of Excel features. Candidates must analyze the requirements of each task, determine the appropriate tools and functions, and implement solutions efficiently. Some tasks may focus on formula construction, while others emphasize automation or data visualization. Developing the ability to quickly interpret task requirements and apply the correct approach is essential, as is verifying that solutions are accurate and meet the specified objectives
Building Confidence Through Systematic Study
Confidence is built through systematic study and repeated practice. Candidates should create a study plan that allows them to explore all aspects of Excel in depth, gradually increasing the difficulty of tasks. Engaging with practical projects, simulating real-world applications, and refining workflows help build the ability to respond to complex challenges under time constraints. Regular review and hands-on practice solidify understanding, reduce errors, and improve overall performance in the exam environment
Mastery of Formulas and Function Combinations
Mastery of formulas and the ability to combine multiple functions is a distinguishing feature of expert-level Excel users. Candidates are expected to apply logical, lookup, and data analysis functions in tandem to solve problems efficiently. Understanding how to construct dynamic formulas, troubleshoot errors, and ensure accuracy across datasets is crucial. Practice in creating complex, integrated formulas builds both skill and confidence, preparing candidates to handle a wide range of tasks in the exam
Leveraging Automation for Efficiency
Automation is a cornerstone of advanced Excel expertise. Candidates must demonstrate the ability to use macros to perform repetitive tasks quickly and accurately. This involves not only recording and executing macros but also understanding how to modify them to suit different scenarios. Automation reduces manual effort, minimizes errors, and ensures consistent results, reflecting the practical skills expected of expert users. Effective use of macros demonstrates both technical capability and strategic thinking in managing Excel workflows
Advanced Data Management Techniques
Managing data efficiently is critical for expert-level Excel use. Candidates are expected to apply techniques such as data validation, conditional formatting, advanced filtering, and structured data organization. These skills ensure that datasets are accurate, accessible, and ready for analysis. Understanding how to structure data for maximum usability, prevent errors, and enable efficient processing is a key aspect of preparation. The ability to manipulate and organize complex datasets is essential for successfully completing the exam tasks
Creating Meaningful Visualizations
Creating meaningful visualizations is central to advanced Excel expertise. Candidates must demonstrate the ability to design charts and pivot tables that effectively summarize and interpret data. This requires both technical proficiency and analytical insight, as visualizations must convey the correct message and highlight trends clearly. Customizing charts and pivot tables to suit specific analytical needs allows candidates to present data in ways that support decision-making and demonstrate expert-level skills
Combining Efficiency and Accuracy
Success in the exam requires balancing efficiency with accuracy. Candidates must complete multiple tasks within a limited time while ensuring that calculations, formatting, and data analysis are precise. Developing workflows that minimize redundant steps, using shortcuts effectively, and applying features strategically are key to maintaining both speed and quality. Practicing under timed conditions helps build this balance, ensuring readiness for the challenges of the exam
Continuous Skill Improvement
Even experienced Excel users benefit from focused preparation for the exam. The process of preparing helps refine existing skills, uncover gaps in knowledge, and enhance problem-solving capabilities. Regular practice with advanced formulas, macros, data management, and visualizations deepens understanding and builds confidence. The exam preparation process itself serves as a valuable learning experience, expanding expertise and reinforcing the practical application of Excel in complex scenarios
Integration of Knowledge and Practice
The exam emphasizes the integration of technical knowledge and practical application. Tasks often combine multiple skill areas, requiring candidates to apply formulas, manage data, automate processes, and create visualizations within a single project. This integrated approach reflects real-world usage, where multiple Excel functions must be applied cohesively. Developing the ability to think strategically, plan workflows, and implement solutions effectively is essential for achieving expert-level performance
Preparing for Time Pressure
Time management is one of the most challenging aspects of the exam. Candidates must complete all tasks efficiently while maintaining accuracy. Practicing with realistic time constraints, using shortcuts, and developing strategies to prioritize tasks are critical for success. Understanding which tasks can be completed quickly and which require more careful attention allows candidates to allocate time effectively and avoid common pitfalls
Practical Applications and Real-World Scenarios
The exam mirrors real-world Excel applications, requiring candidates to handle complex datasets, automate repetitive tasks, and present data visually. Tasks are designed to reflect professional requirements, such as analyzing trends, summarizing information, and generating actionable insights. By practicing these types of scenarios, candidates develop the skills necessary to apply Excel expertise effectively in workplace contexts
Developing Analytical Thinking
Analytical thinking is a key component of success in the exam. Candidates must evaluate data, identify patterns, and choose the appropriate tools and methods to achieve results. This involves understanding the logic behind formulas, recognizing relationships within datasets, and applying advanced functions to derive meaningful insights. Strong analytical skills enable candidates to approach tasks strategically, solve problems efficiently, and produce accurate outputs
Workflow Optimization and Best Practices
Efficiency in Excel is achieved through optimized workflows and adherence to best practices. Candidates should focus on structuring workbooks logically, applying consistent formatting, and using automation to reduce repetitive steps. Understanding best practices for formula construction, data organization, and visualization enhances performance and ensures that tasks are completed both quickly and accurately. Optimized workflows also reflect professional-level proficiency in managing complex Excel projects
Building Confidence Through Experience
Confidence comes from repeated exposure to complex Excel tasks and the successful application of advanced features. Candidates should engage with challenging exercises, simulate exam conditions, and review the outcomes to refine their approach. Developing familiarity with various Excel functionalities, understanding their applications, and practicing integration across tasks build the competence needed to excel in the exam environment
Comprehensive Preparation Approach
A comprehensive preparation approach involves combining technical mastery, practical experience, and strategic time management. Candidates should systematically cover all skill areas, practice integrated tasks, and simulate exam conditions to develop speed, accuracy, and confidence. Continuous assessment of progress, identification of weaknesses, and targeted practice ensure that preparation is focused and effective, enabling candidates to handle the full range of tasks expected in the exam
The advanced Excel exam is a rigorous assessment of expert-level proficiency, evaluating the ability to manage data, create complex formulas, automate tasks, and develop insightful visualizations. Success requires a combination of technical knowledge, practical experience, analytical thinking, and efficient workflow management. Preparation involves systematic practice, mastery of advanced features, and strategies to manage time effectively. Achieving this certification demonstrates a high level of skill and readiness to apply Excel expertise in complex, real-world scenarios
Understanding the Nature of the Advanced Excel Certification
This certification serves as evidence that an individual possesses expert-level knowledge and proficiency in Excel. It is specifically designed to measure advanced competencies that go beyond standard usage of spreadsheets. Candidates who achieve this credential demonstrate their ability to work with large volumes of data, apply complex formulas, automate repetitive tasks, and present data in a way that supports decision-making processes. The exam associated with this certification is performance-based, requiring candidates to complete tasks within Excel itself rather than answering multiple-choice questions. This ensures that only those with genuine hands-on expertise can succeed
The test structure is practical, reflecting tasks commonly performed in professional settings. Projects provided in the exam consist of several steps that must be carried out correctly to receive credit. Because the assessment is time-constrained, it does not simply measure technical knowledge but also the ability to apply that knowledge efficiently under pressure. Those who earn the certification prove that they are capable of handling demanding tasks in real-world environments where accuracy and speed are equally important
Core Competencies Measured
One of the primary focus areas of the exam is workbook management. Candidates must demonstrate their ability to prepare workbooks for collaboration, apply security features such as restricted editing or password protection, and configure workbook settings for efficient use. They also need to be familiar with enabling and managing macros, organizing workbook structures, and working with multiple sheets cohesively. These skills ensure that data is not only well-organized but also secure and easily accessible to intended users
Data management is another core component. This includes applying advanced formatting rules, validating input, using Flash Fill efficiently, and setting up filtering systems to extract meaningful subsets of information. Conditional formatting rules may need to be applied in complex ways to highlight trends, detect anomalies, or flag potential errors within datasets. These tasks test both technical proficiency and an analytical mindset, as candidates must understand what the data represents in order to manage it effectively
The certification also places a strong emphasis on formulas and functions. Candidates must master logical functions, lookup functions, and functions related to time and date analysis. They are required to use combinations of functions to construct dynamic formulas capable of solving multi-layered problems. The exam often includes scenarios where data analysis functions are necessary to summarize, calculate, or interpret datasets in meaningful ways. Troubleshooting errors in formulas is an additional requirement, since real-world spreadsheets often involve large interdependent calculations where mistakes can occur
Macros form a significant part of the assessment as well. Automation is a crucial element of advanced Excel use, and candidates must show that they can record, name, and edit macros to streamline repetitive tasks. Being able to modify macros to handle different workbook contexts reflects adaptability and technical depth. The exam assesses not only the ability to create simple macros but also the understanding of how they can be integrated into broader workflows
Visualization and analysis are also tested extensively. Candidates must be able to design advanced charts, create pivot tables, and generate pivot charts that allow data to be interpreted quickly and accurately. This requires not only technical familiarity with Excel’s visualization tools but also the judgment to select the most appropriate way to represent information. Effective visualization demonstrates the candidate’s ability to transform raw data into insights, which is a crucial skill in professional environments where data-driven decisions are made
Exam Conditions and Expectations
The format of the test is designed to simulate real-world challenges. Multiple projects are provided, each consisting of several tasks that must be completed correctly. The limited timeframe adds additional pressure, requiring candidates to balance accuracy with speed. Each task contributes to the overall score, and partial credit may be awarded if parts of a task are completed correctly. The passing score is set at a level that allows for minor mistakes, but candidates must still demonstrate strong proficiency across all tested areas to succeed
Because the exam is conducted in a controlled environment, candidates cannot rely on external tools or references. All solutions must be derived using Excel itself, requiring familiarity with built-in features and the ability to apply them quickly. This mirrors the way Excel is often used in professional settings, where efficiency and adaptability are as important as technical knowledge
Preparation Approaches
Preparing for the certification requires a structured and disciplined approach. The first step is gaining familiarity with the exam objectives, ensuring that each of the skill areas is understood in detail. Candidates should review advanced workbook settings, data management tools, formula construction techniques, and visualization methods. Identifying personal skill gaps is essential, as these areas require additional practice and focus. For example, a candidate comfortable with formulas but less experienced with macros should dedicate time to learning and practicing macro creation and modification
Practical application is the most effective way to prepare. Rather than simply reading about features, candidates should complete tasks in Excel repeatedly until they can perform them quickly and accurately. Creating practice projects that mimic exam conditions is highly beneficial. These projects can combine tasks such as applying conditional formatting, constructing formulas, and generating charts within a single dataset. By practicing integrated tasks, candidates build the ability to switch between skill areas seamlessly, which is exactly what the exam requires
Time management should also be a core part of preparation. Many candidates fail because they run out of time before completing the exam. Practicing with a timer helps develop efficiency and prevents the common mistake of spending too long on one complex task. Developing shortcuts, such as memorizing keyboard commands and learning faster ways to navigate the workbook, can make a significant difference in overall performance
Practical Applications of Skills
The tasks in the exam are closely tied to how Excel is used in the workplace. Workbook management skills apply to maintaining consistency in team projects and protecting sensitive information. Data management skills are necessary for preparing datasets that can be analyzed accurately, ensuring that errors or inconsistencies do not undermine the results. Advanced formulas and functions are crucial for solving complex business problems, such as financial forecasting, statistical analysis, or operational tracking. Automation through macros saves time in repetitive reporting processes, while visualization skills allow professionals to present findings in a way that decision-makers can easily interpret
The practical nature of these skills highlights why this certification carries significant value. Candidates who pass are not just knowledgeable about Excel—they are capable of applying its most powerful features to solve real problems effectively. This makes the credential highly respected and sought after by organizations that rely heavily on accurate data analysis and reporting
Overcoming Common Challenges
One of the main difficulties candidates face is adapting to the time pressure of the exam. To overcome this, practice under timed conditions is essential. Another challenge is troubleshooting formulas during the test. Errors can occur if references are misapplied or functions are nested incorrectly. Developing a systematic approach to diagnosing and fixing formula errors is crucial. Some candidates also struggle with macros, especially if they are unfamiliar with recording and editing them. Practicing macros in different contexts helps build confidence in this area
Visualization can also present difficulties, particularly when deciding which type of chart best represents a dataset. Understanding when to use bar charts, line charts, or pivot charts requires both technical knowledge and analytical judgment. Building practice projects that require different types of visualizations helps develop this skill and ensures that candidates are prepared to make quick decisions during the exam
Long-Term Benefits of Certification
Achieving this certification has long-term benefits for career development and personal expertise. It provides formal recognition of advanced Excel proficiency, which is valuable in professional roles where data management and analysis are critical. It also builds personal confidence, as candidates who pass know that they can perform at an expert level under pressure. The process of preparing for the exam itself enhances skills significantly, ensuring that candidates gain deeper knowledge of Excel’s most advanced features. These improvements can be applied directly to workplace tasks, making professionals more efficient and effective in their roles
The certification also serves as a benchmark of excellence. In environments where Excel is a standard tool, having proof of expert-level skills can distinguish an individual from their peers. It reflects a commitment to continuous improvement and professional development, qualities that are highly valued in data-driven fields. Beyond external recognition, achieving certification also fosters personal satisfaction, as it represents the culmination of disciplined study, practice, and mastery of complex technical skills
The advanced Excel certification is a challenging yet rewarding credential that confirms an individual’s expertise in one of the most widely used data tools. It tests practical skills across workbook management, data handling, formulas, macros, and visualizations, requiring candidates to demonstrate proficiency under strict time constraints. Preparation demands a disciplined approach focused on practice, efficiency, and integration of multiple skills. Those who achieve certification prove that they can apply Excel’s most advanced features effectively, making them highly capable in professional contexts where data accuracy, efficiency, and insight are essential
Nature of the Advanced Excel Assessment
The advanced Excel assessment represents one of the most rigorous validations of spreadsheet proficiency. It is not designed for casual users but rather for individuals who need to show mastery of complex data processes, advanced calculations, automation, and visualization. Unlike beginner or intermediate-level tests that emphasize basic formulas and formatting, this examination focuses on high-level problem solving, efficiency under time constraints, and the ability to integrate multiple features of Excel into coherent solutions. The tasks are structured in a way that simulates workplace scenarios, requiring candidates to not only know what to do but to demonstrate how quickly and accurately they can apply their skills
The exam is performance-based, meaning that every task must be completed within Excel itself. There are no multiple-choice questions, no theoretical discussions, and no room for guessing. Success depends entirely on a candidate’s ability to manipulate data, design formulas, automate processes, and build visualizations directly within spreadsheets. This method ensures that those who earn certification have genuinely developed practical competence rather than just theoretical familiarity
Technical Skills at the Core of the Exam
One of the central skills tested is the management of workbooks. Candidates must prepare spreadsheets for collaboration, apply protections to ensure that sensitive data is secure, and manage structural elements so that workbooks remain organized. This involves configuring settings, applying restrictions on editing, and enabling macros when required. Such tasks replicate situations in professional environments where large teams work together on shared files and where maintaining both accuracy and security is critical
Data handling is another vital area. Candidates must demonstrate expertise in applying advanced formatting rules, using validation to control data input, applying conditional formatting to highlight trends or issues, and filtering large sets of information to find relevant subsets. These are not superficial skills but rather practical techniques that ensure datasets are both reliable and usable for deeper analysis. In practice, a candidate may need to quickly identify outliers in financial records, enforce consistent data entry across a large team, or format results in a way that highlights important trends. The exam mirrors these real-world applications by including tasks that require candidates to handle data carefully and thoughtfully
Formulas and functions make up the largest share of the assessment. Proficiency in logical operations, lookup functions, time-based calculations, and statistical or analytical functions is expected. The exam requires not only isolated knowledge of each function but also the ability to combine multiple functions into powerful, dynamic formulas. Troubleshooting is another important element, as errors in complex spreadsheets are common and must be resolved quickly. Mastery in this area demonstrates that a candidate is able to perform advanced data analysis, make predictions, and produce calculations that drive business decisions
Automation through macros adds another dimension. Candidates must be able to record, name, and edit macros that automate repetitive processes. This involves more than simply pressing record; it requires understanding what tasks are best automated, ensuring that macros are reusable, and integrating them into broader workflows. Automation reflects the professional need to save time, reduce human error, and standardize repetitive actions across large datasets. The ability to manipulate macros successfully is one of the hallmarks of an expert Excel user, and the exam’s inclusion of this component ensures that certification is awarded only to those who can streamline work effectively
Visualization and advanced reporting form the final component. Candidates are expected to create complex charts, pivot tables, and pivot charts that communicate insights effectively. These visualizations must not only be technically correct but also meaningful. A chart that fails to convey the intended message is considered ineffective, no matter how well it is formatted. Thus, candidates must understand the analytical reasoning behind visualization choices, selecting the right chart types and customizing them to highlight trends, comparisons, or summaries. By testing this, the exam ensures that certified individuals can translate raw data into actionable insights that decision-makers can use
Exam Experience and Structure
The exam consists of multiple projects, each containing a series of tasks. These projects reflect real-world scenarios that require candidates to apply a range of Excel features within a short timeframe. Because the duration is limited, efficiency is as important as accuracy. Candidates must navigate through Excel quickly, use shortcuts, and apply their knowledge without hesitation. This design ensures that the certification reflects not only technical knowledge but also the ability to perform under conditions similar to those faced in professional environments
Each project may include a mix of tasks such as constructing formulas, applying conditional formatting, designing pivot tables, and recording macros. The variety prevents candidates from focusing on only one area of strength; instead, they must demonstrate comprehensive expertise across all major functions of Excel. Partial credit may be awarded for partially correct tasks, but overall success requires a high level of proficiency across all skill domains
Preparation Strategies and Approaches
Preparing for the assessment requires more than casual practice. A systematic approach is necessary to ensure that all skill areas are covered in depth. One of the first steps in preparation is becoming thoroughly familiar with the exam outline, which details the specific tasks and skills that will be tested. Once candidates understand the requirements, they can assess their current abilities and identify gaps. Targeted practice on weaker areas ensures that no skill is left unrefined
Hands-on practice is the most effective preparation method. Rather than studying theory or passively watching demonstrations, candidates should create their own projects in Excel that replicate the exam environment. For instance, they can simulate tasks like cleaning large datasets, creating lookup-based formulas, automating processes with macros, and producing pivot charts. Practicing these tasks repeatedly builds speed and accuracy, both of which are critical under exam conditions
Time management should also be emphasized during preparation. Many candidates struggle not because they lack knowledge but because they cannot complete all tasks in the allotted time. Practicing with a timer can help develop efficiency. Using keyboard shortcuts, minimizing unnecessary steps, and adopting efficient workflows contribute to faster task completion. The ability to maintain accuracy while working quickly is a distinguishing feature of successful candidates
Challenges Faced by Candidates
The exam is intentionally demanding, and many candidates encounter common challenges. One major difficulty is handling the time pressure. The projects must be completed within a relatively short window, leaving little room for hesitation. Candidates often find themselves stuck on a difficult task and run out of time for others. To overcome this, it is important to practice prioritization, moving on when necessary and returning later if time allows
Another challenge is troubleshooting formulas. Complex formulas often involve nested functions and absolute references, and errors are common. Without a systematic approach to identifying mistakes, candidates can waste valuable time. Developing strategies for troubleshooting—such as breaking formulas into smaller components and checking references—can prevent frustration and save time during the exam
Macros are another source of difficulty. Many candidates are unfamiliar with recording and editing them, which can lead to mistakes or incomplete tasks. Practicing macro creation in different contexts builds confidence and reduces the likelihood of errors. Similarly, visualization tasks may cause confusion if candidates are unsure which chart best represents the data. Understanding the strengths and limitations of each chart type, and practicing with varied datasets, ensures readiness for these challenges
Real-World Relevance
What makes this certification particularly valuable is its close alignment with professional requirements. Every skill tested has direct applications in workplaces where Excel is used extensively. Workbook management ensures consistency and security in collaborative environments. Data handling allows for accurate preparation of information before analysis. Advanced formulas and functions enable precise calculations for forecasting, budgeting, and statistical interpretation. Automation through macros streamlines repetitive processes, saving both time and resources. Visualization skills ensure that findings are communicated clearly to stakeholders. Because the exam reflects these real-world needs, passing it demonstrates that a candidate can operate effectively in demanding professional contexts
Value of Certification
Obtaining this certification offers significant professional and personal benefits. For professionals, it validates expertise that can distinguish them in competitive job markets. Employers often look for individuals who can handle complex data tasks efficiently, and this credential provides clear evidence of that ability. For individuals, it builds confidence, proving that they can meet the challenges of expert-level Excel use. Beyond external recognition, the process of preparing for and completing the exam enhances practical skills that can be applied immediately in the workplace. The certification represents not just an achievement but also the culmination of disciplined study and mastery of complex tools
Long-Term Skill Development
The preparation and attainment of this certification encourage continuous learning. Excel evolves with new features and functionalities, and those who achieve certification are more likely to continue refining their skills. The disciplined approach developed during preparation fosters an ongoing commitment to skill development. Even after passing, certified individuals benefit from improved efficiency, deeper understanding of Excel’s capabilities, and greater adaptability in handling new challenges. This makes the certification a foundation for long-term professional growth and expertise
The advanced Excel certification is a rigorous and practical test of expertise, requiring candidates to demonstrate mastery across workbook management, data handling, formulas, macros, and visualization. Its structure ensures that only those who can perform under pressure with both accuracy and speed are awarded the credential. Preparation requires systematic study, extensive practice, and strong time management strategies. Despite the challenges, earning the certification provides significant benefits, including professional recognition, personal confidence, and enhanced workplace effectiveness. More importantly, it reflects the ability to apply Excel at its highest level to solve real-world problems, making it a valuable milestone in the development of data management and analytical expertise
Advanced Excel Certification as a Professional Benchmark
The advanced Excel certification stands as one of the most important markers of technical ability for individuals working with data. Unlike general computer literacy tests, this exam evaluates practical knowledge and the ability to manage complex tasks under strict conditions. It is not aimed at those who only use spreadsheets occasionally but at professionals who need to transform large amounts of information into meaningful insights. The focus of the exam is not simply knowing the functions of Excel but demonstrating mastery through performance-based tasks. Every candidate is required to complete real exercises that mirror professional challenges, making the certification a benchmark for serious data work
The credibility of the exam comes from the fact that it demands advanced capabilities. It tests candidates on tasks that require accuracy, logical reasoning, technical depth, and speed. The projects simulate real-life scenarios that one might encounter in roles where Excel is central to daily responsibilities. By earning the certification, individuals validate that they can meet the demands of such roles and manage data-driven processes effectively
Scope of Skills Evaluated
A broad range of skills is assessed, ensuring that those who pass can handle Excel in its most demanding capacity. One of the central elements is workbook preparation and management. This includes applying workbook protection, managing permissions, linking sheets, and configuring workbook settings to ensure proper collaboration. Candidates also need to understand advanced workbook properties such as controlling calculation modes, customizing options for large data sets, and streamlining structures for performance
Data management represents another key skill area. Excel is often used to process large volumes of raw data, and the exam requires candidates to demonstrate techniques for cleaning, organizing, and validating data. Tasks such as applying conditional formatting with advanced criteria, enforcing input rules, extracting subsets of information with filters, and using advanced sorting are all part of this domain. By assessing this, the exam ensures candidates can maintain integrity and usability in data-heavy environments
The most challenging area for many is formulas and functions. These range from simple logical functions to complex nested formulas involving multiple categories of functions. Candidates must demonstrate skill in using lookup functions, conditional calculations, text manipulation, financial functions, and statistical operations. Additionally, the ability to combine these into larger formulas that solve real-world problems is critical. Understanding how to troubleshoot formulas and quickly identify why errors occur is another vital part of this skillset, reflecting the fact that real-world spreadsheets often require debugging and problem-solving under pressure
Automation through macros is equally important. The exam requires candidates to not only record macros but also modify them so that they can be applied flexibly across different workbooks. This reflects the real-world use of macros to automate repetitive reporting processes, data manipulations, or formatting tasks. Understanding how to integrate macros into broader workflows is a clear sign of expert-level Excel knowledge, as it demonstrates both efficiency and technical adaptability
Another crucial area is data visualization and analysis. Candidates must build pivot tables and pivot charts, apply advanced charting options, and customize visuals so that the data tells a story. These tasks test both technical skill and analytical decision-making. A candidate must be able to look at a dataset, determine which visualization will best represent it, and then execute that choice effectively. This ensures the certification reflects not just the ability to manipulate numbers but also the ability to communicate insights clearly and persuasively
Exam Process and Structure
The exam is project-based, requiring candidates to complete multiple scenarios. Each project contains several tasks, and all must be finished within a set timeframe. The structure is deliberately designed to reflect workplace challenges, where a professional might be given a dataset and asked to analyze, process, and present it under time pressure. Because of this format, the exam does not only test knowledge but also workflow efficiency. Those who can complete tasks quickly and accurately while navigating between different tools will succeed, while those who rely on slow step-by-step approaches may find themselves running out of time
Candidates receive partial credit for partially correct tasks, but the overall threshold for passing ensures that only highly proficient individuals earn the certification. This makes the credential both respected and reliable, as it reflects consistent expertise across multiple areas rather than competence in only one or two
Preparation and Study Methods
Effective preparation involves more than memorizing functions or watching tutorials. Because the exam requires performance under time limits, candidates must train themselves in speed, accuracy, and efficiency. One of the most useful strategies is practicing with real datasets rather than hypothetical examples. This allows candidates to experience the complexity of real information and learn how to clean, analyze, and present it effectively. Practicing with mock projects that combine workbook management, formula construction, and visualization helps simulate the integrated nature of the exam
Candidates should also focus on time management strategies. For example, they may practice allocating a fixed number of minutes per task and learning when to move on from a difficult problem to avoid losing valuable time. Familiarity with Excel shortcuts and efficient navigation methods is also crucial. Small improvements in workflow speed can have a large impact during the exam
It is also helpful to create personal projects that push beyond comfort zones. If a candidate feels confident with formulas but less so with macros, deliberately creating projects that rely heavily on macros can close the gap. Similarly, experimenting with advanced charting techniques can improve readiness for the visualization tasks. By identifying weak areas and addressing them directly, candidates can prepare themselves to perform consistently across all parts of the exam
Common Obstacles and How to Overcome Them
The exam is designed to challenge even experienced users, and there are common difficulties that many candidates encounter. One frequent obstacle is troubleshooting formulas. When working under time constraints, small errors in references or syntax can waste valuable minutes. The best way to prepare for this is by practicing systematic troubleshooting methods, such as breaking down formulas into smaller parts, checking references one at a time, and using built-in error-checking tools effectively
Another challenge lies in data visualization. Many candidates can technically create charts but struggle to choose the most effective type for a dataset. Practicing with varied datasets and forcing oneself to justify chart choices is an excellent way to build the judgment needed for this part of the exam. Similarly, macros can be intimidating for those who have not worked extensively with them. Regularly practicing macro recording and editing across different types of workbooks helps build both confidence and adaptability
Time management is perhaps the greatest challenge of all. Many candidates know how to perform the tasks but cannot finish them in time. The only solution is deliberate practice under timed conditions. The more familiar a candidate becomes with the pressure of working against the clock, the better their chances of success
Applications in Professional Environments
The skills tested in the certification are not abstract; they directly apply to the workplace. Workbook management skills are essential when multiple individuals collaborate on financial reports or operational datasets. Data management ensures that large sets of customer, sales, or performance data remain accurate and usable. Advanced formulas and functions are critical for building models, making forecasts, and generating insights that guide decision-making. Automation through macros saves time in reporting cycles, reduces errors, and ensures consistency in routine tasks. Visualization allows professionals to transform complex numbers into insights that executives and stakeholders can act upon
By aligning so closely with workplace needs, the certification ensures that those who earn it are equipped to handle responsibilities in data-intensive roles. It is this practical relevance that makes the certification valuable to both individuals and organizations
Long-Term Impact of Certification
Earning the certification has both immediate and lasting benefits. In the short term, it provides formal recognition of advanced Excel expertise, which can distinguish an individual in professional contexts. It also builds personal confidence, proving that the individual can work effectively under pressure with complex tasks. In the long term, it fosters habits of precision, efficiency, and continuous learning. Candidates who prepare for and achieve the certification tend to develop a deeper understanding of Excel that serves them well beyond the exam itself. They are better able to adapt to new features, handle evolving data challenges, and maintain a high standard of performance in their professional roles
The advanced Excel certification is one of the most comprehensive assessments of spreadsheet expertise. It evaluates practical performance in workbook management, data handling, formulas, automation, and visualization. The exam’s project-based structure ensures that success reflects real-world competence, not just theoretical knowledge. Preparation requires deliberate practice, efficient workflows, and effective time management. While the exam poses significant challenges, those who achieve certification demonstrate not only technical mastery but also the ability to perform under demanding conditions. The result is a credential that carries both professional recognition and practical value, confirming that the certified individual can operate at the highest level of Excel proficiency
Understanding the Depth of the Certification
The advanced Excel certification is not just another assessment of software skills but an evaluation of how efficiently a candidate can apply knowledge in realistic, high-pressure situations. Unlike basic assessments that measure familiarity with simple features, this exam measures whether someone can manage complex spreadsheets, create dynamic solutions, and analyze data at a level suitable for professional environments. It recognizes individuals who can navigate advanced functionalities, bringing together analytical thinking, problem-solving, and technical mastery in Excel
The exam revolves around projects that replicate authentic scenarios professionals face daily. Each project is made up of tasks that assess a variety of abilities, from structuring data to applying formulas, designing visuals, and automating processes. This approach ensures the exam is not only a test of memory but also one of performance. Candidates must demonstrate they can work under pressure while still maintaining accuracy and efficiency, which is why the certification holds weight in professional contexts
Key Competency Areas
Among the most significant domains tested is workbook management. This involves tasks such as configuring workbook properties, securing information through protection settings, linking multiple sheets together, and preparing workbooks for collaboration. These skills ensure candidates are not just working in isolation but can handle spreadsheets in team-oriented environments where security, accuracy, and accessibility are essential
Data handling is another critical area. Spreadsheets often serve as repositories for massive datasets, and the exam measures a candidate’s ability to clean, organize, and manipulate such data effectively. Candidates are expected to use advanced filtering, apply complex conditional formatting, enforce validation rules, and use tools like Flash Fill to transform information quickly. By doing this, the exam highlights whether individuals can ensure data integrity and usability under real conditions
Formulas and functions represent the technical heart of Excel. The exam covers everything from logical functions to lookup functions, text and date operations, and data analysis functions. More than simply knowing the formulas, candidates must show that they can integrate them into efficient solutions for practical tasks. Troubleshooting formulas, identifying where they go wrong, and fixing them effectively is part of the challenge. This reflects real-world work where formulas drive calculations and analysis but often require adjustments when datasets change
Automation through macros is another vital skill area. Candidates must demonstrate they can record macros, modify them, and apply them flexibly to different workbooks. This part of the exam emphasizes efficiency because in professional settings, repetitive tasks need to be streamlined. By assessing macros, the exam ensures that certified individuals can create scalable, reusable processes that save time and reduce human error
Visualization and advanced reporting complete the skillset. Candidates must show they can build pivot tables, pivot charts, and customized visuals that summarize complex datasets in a way that decision-makers can understand. Choosing the right visualization, applying formatting, and making the chart or table both clear and meaningful is crucial. This not only demonstrates technical ability but also communication skills, as effective data representation is as important as accurate calculations
Exam Format and Time Constraints
The structure of the exam is deliberately challenging. Candidates face a set of projects, each divided into multiple tasks. The total number of tasks is typically enough to require strict time management, and every task builds on practical, real-life scenarios. The time limit is tight, pushing candidates to work efficiently without overthinking any one problem. This makes familiarity with the software essential. Those who rely on slow or manual processes will likely struggle to complete the exam in time
The scoring system awards points for correct tasks, with partial credit available when some steps are performed correctly even if the entire task is not perfect. The threshold for passing is set high enough that only candidates with strong knowledge across multiple areas can achieve success. This ensures the certification is meaningful and reflects well-rounded expertise
Preparation Strategies
Preparing for this certification requires a structured and disciplined approach. Unlike basic tests where light practice may be sufficient, this one demands extensive practice with real tasks. Candidates benefit from working with large and varied datasets, experimenting with advanced formulas, and creating projects that simulate the mix of tasks expected on the exam. Practicing under timed conditions is particularly important, as the biggest obstacle for many candidates is running out of time rather than lacking knowledge
A useful preparation method is to focus on weak areas early. By reviewing the exam’s skill outline, candidates can identify the domains where they feel least confident. Dedicating more time to these areas ensures balance, as the exam is designed to test across all competencies rather than focusing heavily on just one. Candidates should also practice integrating multiple skills at once, since projects in the exam rarely isolate a single function or feature but instead combine several into one scenario
Familiarity with keyboard shortcuts and efficient navigation tools is another preparation technique that can save valuable time. Even small time savings across multiple tasks can make the difference between completing all projects and falling short. Developing habits of speed and accuracy simultaneously ensures readiness for the test’s demanding structure
Obstacles During the Exam
One of the most common difficulties candidates face is troubleshooting formulas under time pressure. Errors in references, misapplied functions, or misplaced parentheses can derail calculations. Practicing systematic error-checking processes can help overcome this, such as breaking formulas into smaller components or relying on built-in auditing features to trace problems
Another obstacle is choosing appropriate visualizations. While many candidates can generate charts, the challenge lies in selecting the type that best represents the dataset and communicates the results effectively. Practicing with varied types of data and reflecting on chart choices helps build the judgment needed for this skill. Automation tasks can also intimidate those unfamiliar with macros. Regular practice in recording, editing, and applying macros in different contexts ensures smoother performance when they appear on the exam
Time management, however, remains the most significant challenge. Even experienced Excel users may find themselves unable to finish if they spend too much time on one task. Practicing under strict time constraints is the only reliable way to build confidence and efficiency for the exam environment
Professional Applications of Certified Skills
The competencies validated by this certification directly reflect the demands of professional environments. Workbook management skills are crucial for collaborative reporting, budget preparation, or operational tracking. Data handling ensures raw information is reliable, structured, and ready for use in decision-making. Complex formulas allow for financial modeling, forecasting, and performance analysis, while automation through macros reduces the burden of repetitive tasks and ensures consistency across processes. Visualization makes insights accessible, allowing decision-makers to act based on clear and accurate reports
These abilities are not limited to a single profession but apply across industries such as finance, operations, analysis, administration, and management. By focusing on practical performance, the certification proves that an individual can step into roles where Excel is central to responsibilities and deliver results without needing extensive additional training
Long-Term Benefits
Achieving certification provides both immediate recognition and lasting advantages. In the short term, it demonstrates an individual’s ability to work at an expert level, distinguishing them in competitive professional environments. It also builds personal confidence, as those who pass have proven they can meet the exam’s high demands. In the long term, preparing for and completing the certification fosters habits of precision, efficiency, and adaptability. Certified individuals often develop a deeper understanding of Excel that allows them to adapt to new challenges, integrate advanced features as they are released, and maintain high productivity in evolving work environments
The certification also reflects a mindset of continuous learning and growth. Because the exam requires more than surface-level familiarity, individuals who succeed often carry forward the discipline of structured problem-solving and the drive to refine their skills continuously. This makes the certification more than a one-time achievement, but rather a foundation for ongoing professional development
Conclusion
The advanced Excel certification represents one of the most comprehensive measures of spreadsheet expertise available. By testing workbook management, data handling, formulas, automation, and visualization, it ensures that certified individuals are not only technically skilled but also capable of applying those skills in real-world contexts. Its project-based structure demands efficiency, accuracy, and the ability to integrate multiple competencies at once. Preparation requires deliberate practice, time management, and a commitment to addressing weak areas. While the exam is challenging, the reward is a credential that carries significant professional value and confirms mastery of Excel at the highest level
Microsoft Excel Expert MO-201 practice test questions and answers, training course, study guide are uploaded in ETE Files format by real users. Study and Pass MO-201 Microsoft Excel Expert (Excel and Excel 2019) certification exam dumps & practice test questions and answers are to help students.
- AZ-104 - Microsoft Azure Administrator
- AZ-305 - Designing Microsoft Azure Infrastructure Solutions
- AB-100 - Agentic AI Business Solutions Architect
- AI-103 - Developing AI Apps and Agents on Azure
- SC-300 - Microsoft Identity and Access Administrator
- DP-700 - Implementing Data Engineering Solutions Using Microsoft Fabric
- PL-300 - Microsoft Power BI Data Analyst
- AB-900 - Microsoft 365 Copilot and Agent Administration Fundamentals
- MD-102 - Endpoint Administrator
- SC-200 - Microsoft Security Operations Analyst
- AZ-900 - Microsoft Azure Fundamentals
- SC-401 - Administering Information Security in Microsoft 365
- MS-102 - Microsoft 365 Administrator
- DP-600 - Implementing Analytics Solutions Using Microsoft Fabric
- SC-100 - Microsoft Cybersecurity Architect
- AZ-700 - Designing and Implementing Microsoft Azure Networking Solutions
- AZ-500 - Microsoft Azure Security Technologies
- AI-900 - Microsoft Azure AI Fundamentals
- AB-731 - AI Transformation Leader
- AB-730 - AI Business Professional
- GH-300 - GitHub Copilot
- AI-102 - Designing and Implementing a Microsoft Azure AI Solution
- PL-400 - Microsoft Power Platform Developer
- AZ-400 - Designing and Implementing Microsoft DevOps Solutions
- AZ-204 - Developing Solutions for Microsoft Azure
- AZ-140 - Configuring and Operating Microsoft Azure Virtual Desktop
- DP-300 - Administering Microsoft Azure SQL Solutions
- AI-901 - Microsoft Azure AI Fundamentals
- SC-900 - Microsoft Security, Compliance, and Identity Fundamentals
- AZ-801 - Configuring Windows Server Hybrid Advanced Services
- SC-500 - Implementing End-to-End Security Controls for Cloud and AI Workloads
- AI-300 - Operationalizing Machine Learning and Generative AI Solutions
- MS-700 - Managing Microsoft Teams
- DP-800 - Developing AI-Enabled Database Solutions
- PL-900 - Microsoft Power Platform Fundamentals
- AZ-800 - Administering Windows Server Hybrid Core Infrastructure
- PL-200 - Microsoft Power Platform Functional Consultant
- PL-600 - Microsoft Power Platform Solution Architect
- DP-750 - Implementing Data Engineering Solutions Using Azure Databricks
- AB-620 - Designing and Building Integrated AI Agent Solutions in Copilot Studio
- MB-310 - Microsoft Dynamics 365 Finance Functional Consultant
- MB-800 - Microsoft Dynamics 365 Business Central Functional Consultant
- DP-900 - Microsoft Azure Data Fundamentals
- MB-330 - Microsoft Dynamics 365 Supply Chain Management
- MB-820 - Microsoft Dynamics 365 Business Central Developer
- MB-230 - Microsoft Dynamics 365 Customer Service Functional Consultant
- MS-721 - Collaboration Communications Systems Engineer
- MB-280 - Microsoft Dynamics 365 Customer Experience Analyst
- AB-410 - Building Intelligent Applications
- GH-900 - GitHub Foundations
- MB-500 - Microsoft Dynamics 365: Finance and Operations Apps Developer
- DP-420 - Designing and Implementing Cloud-Native Applications Using Microsoft Azure Cosmos DB
- GH-200 - GitHub Actions
- MB-700 - Microsoft Dynamics 365: Finance and Operations Apps Solution Architect
- PL-500 - Microsoft Power Automate RPA Developer
- GH-500 - GitHub Advanced Security
- GH-100 - GitHub Administration
- MB-335 - Microsoft Dynamics 365 Supply Chain Management Functional Consultant Expert
- AI-200 - Developing AI Cloud Solutions on Azure
- MS-900 - Microsoft 365 Fundamentals
- MB-240 - Microsoft Dynamics 365 for Field Service
- AZ-120 - Planning and Administering Microsoft Azure for SAP Workloads
- SC-400 - Microsoft Information Protection Administrator
- DP-100 - Designing and Implementing a Data Science Solution on Azure
- GH-600 - Developing in Agentic AI Systems
- 62-193 - Technology Literacy for Educators
- MO-400 - Microsoft Outlook (Outlook and Outlook 2019)
- MS-203 - Microsoft 365 Messaging
Purchase MO-201 Exam Training Products Individually
Why customers love us?
What do our customers say?
The resources provided for the Microsoft certification exam were exceptional. The exam dumps and video courses offered clear and concise explanations of each topic. I felt thoroughly prepared for the MO-201 test and passed with ease.
Studying for the Microsoft certification exam was a breeze with the comprehensive materials from this site. The detailed study guides and accurate exam dumps helped me understand every concept. I aced the MO-201 exam on my first try!
I was impressed with the quality of the MO-201 preparation materials for the Microsoft certification exam. The video courses were engaging, and the study guides covered all the essential topics. These resources made a significant difference in my study routine and overall performance. I went into the exam feeling confident and well-prepared.
The MO-201 materials for the Microsoft certification exam were invaluable. They provided detailed, concise explanations for each topic, helping me grasp the entire syllabus. After studying with these resources, I was able to tackle the final test questions confidently and successfully.
Thanks to the comprehensive study guides and video courses, I aced the MO-201 exam. The exam dumps were spot on and helped me understand the types of questions to expect. The certification exam was much less intimidating thanks to their excellent prep materials. So, I highly recommend their services for anyone preparing for this certification exam.
Achieving my Microsoft certification was a seamless experience. The detailed study guide and practice questions ensured I was fully prepared for MO-201. The customer support was responsive and helpful throughout my journey. Highly recommend their services for anyone preparing for their certification test.
I couldn't be happier with my certification results! The study materials were comprehensive and easy to understand, making my preparation for the MO-201 stress-free. Using these resources, I was able to pass my exam on the first attempt. They are a must-have for anyone serious about advancing their career.
The practice exams were incredibly helpful in familiarizing me with the actual test format. I felt confident and well-prepared going into my MO-201 certification exam. The support and guidance provided were top-notch. I couldn't have obtained my Microsoft certification without these amazing tools!
The materials provided for the MO-201 were comprehensive and very well-structured. The practice tests were particularly useful in building my confidence and understanding the exam format. After using these materials, I felt well-prepared and was able to solve all the questions on the final test with ease. Passing the certification exam was a huge relief! I feel much more competent in my role. Thank you!
The certification prep was excellent. The content was up-to-date and aligned perfectly with the exam requirements. I appreciated the clear explanations and real-world examples that made complex topics easier to grasp. I passed MO-201 successfully. It was a game-changer for my career in IT!


