A00-240: Statistical Business Analysis with SAS 9 Before Retirement
A00-240 is the SAS Statistical Business Analysis Using SAS 9: Regression and Modeling exam. Unlike A00-211 and A00-212, it is still listed by SAS in October 2026, but SAS has announced that the exam will retire on November 30, 2026 and points candidates toward A00-480 Applied Statistics for Machine Learning as an alternative. That timing matters within the broader SAS certifications, especially for candidates still targeting A00-240.
The credential focuses on applied statistical reasoning with SAS/STAT: analysis of variance, linear regression, logistic regression, preparing inputs for predictive models, and measuring model performance. The important word is “analysis.” Candidates must be able to choose a method, check assumptions, interpret parameters and diagnostics, and connect statistical output to a business question.
A strong foundation in linear regression and statistical procedures in SAS is useful, but the exam is broader than fitting a model. Business analysts need to understand data preparation, variable roles, categorical effects, interaction, selection, validation, classification performance, and the difference between statistical significance and practical usefulness.
Model selection starts with the question and the target variable
The choice between ANOVA, linear regression, and logistic regression begins with the outcome being studied and the structure of the predictors. A continuous response may fit a linear model; a categorical outcome may require logistic methods; comparing group means may be expressed through ANOVA. The method should follow the problem, not the analyst’s favorite procedure.
Concepts from statistical fundamentals help candidates distinguish population, sample, parameter, estimate, variability, and uncertainty. Without those foundations, procedure output becomes a collection of numbers rather than evidence about a process or population.
ANOVA is a structured way to reason about group effects and variability
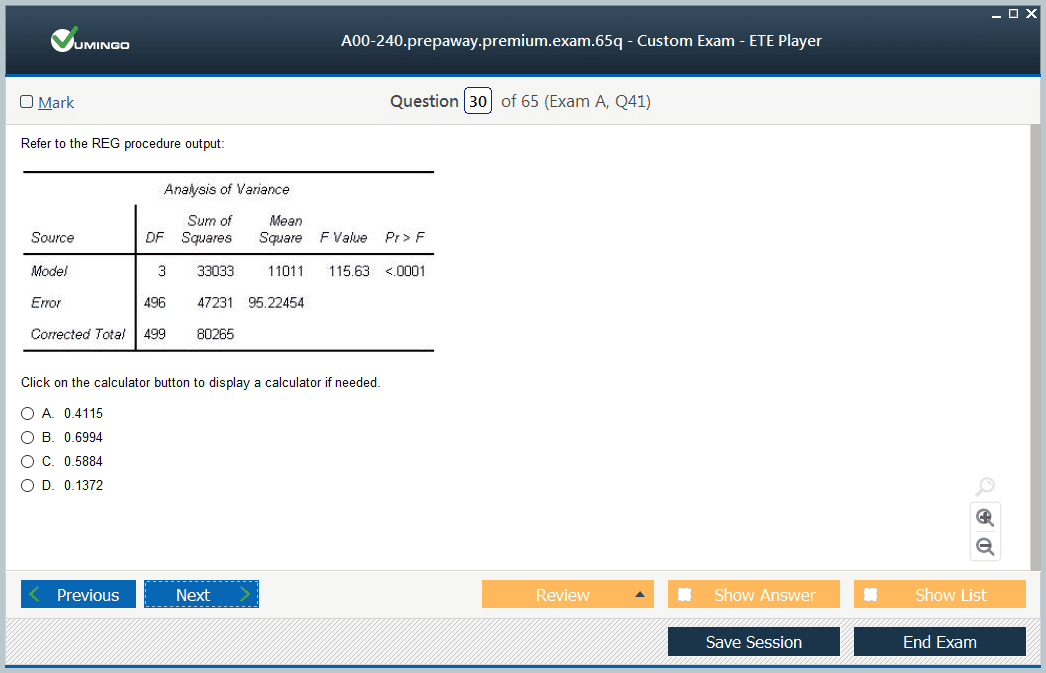
Analysis of variance partitions variability so the analyst can test whether group or factor effects are large relative to unexplained variation. Candidates should understand hypotheses, sums of squares, degrees of freedom, F statistics, p-values, and what a significant overall result does and does not prove. Follow-up comparisons require attention to multiplicity and design.
Business interpretation matters. A statistically detectable difference may be operationally trivial in a very large sample, while a meaningful effect may fail to reach significance in a small or noisy sample. The analyst should report effect size and uncertainty alongside the binary language of significance.
Linear regression requires diagnostics, not just coefficients
A fitted line can look convincing while violating assumptions about linearity, variance, independence, or influential observations. Candidates need to understand residual analysis, leverage, influence, multicollinearity, transformations, and variable selection. A coefficient is only meaningful in the context of the model specification and the other variables held constant.
The distinction between descriptive and inferential work discussed in descriptive versus inferential statistics is especially relevant here. Regression describes relationships in the observed sample, but inference extends claims beyond that sample under assumptions that must be defensible.
Logistic regression changes interpretation because the response is categorical
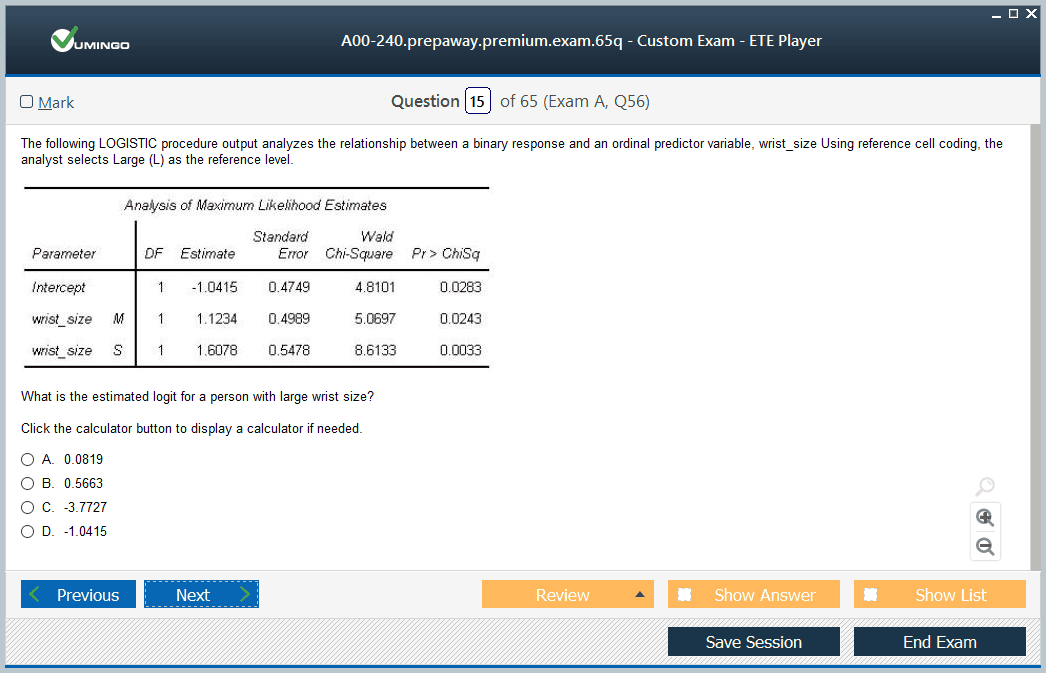
Logistic models estimate the relationship between predictors and the log odds of an event. Analysts need to interpret signs, odds ratios, confidence intervals, reference levels, and predicted probabilities without pretending the coefficient itself is a change in probability. Categorical predictors and interactions require careful parameter interpretation.
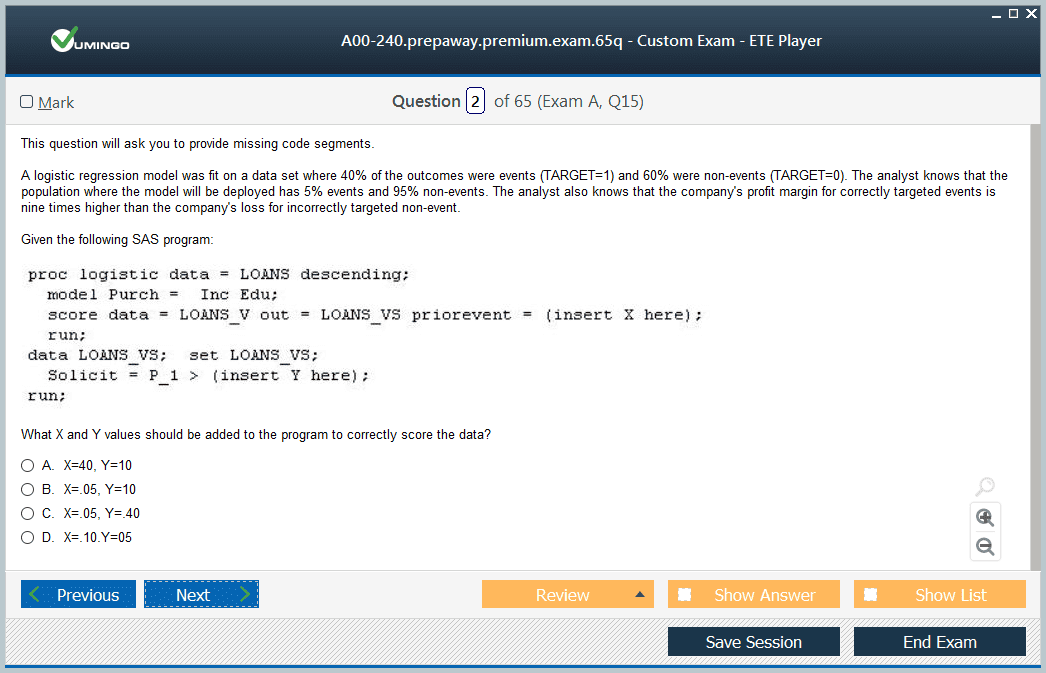
Classification also introduces threshold decisions. A model can rank cases well yet perform poorly at a chosen cutoff if the business costs of false positives and false negatives are asymmetric. The best threshold for fraud, medical risk, marketing response, or credit approval depends on the decision context, not a universal value of 0.5.
Input preparation can improve or destroy predictive performance
Predictive modeling often requires missing-value treatment, transformation, binning, interaction terms, categorical encoding, variable screening, and outlier review. These decisions should be learned from training data and applied consistently to validation or future data. Leakage occurs when information from the outcome or future state enters the predictors and produces unrealistically strong performance.
Analysts should document transformations because model interpretation depends on them. A coefficient on a log-transformed predictor or standardized variable has a different meaning from one on the original scale. Reproducibility requires the scoring process to use exactly the same rules as model development.
Model performance should match the type of decision the model supports
For continuous outcomes, error measures and residual behavior help compare models. For classification, confusion matrices, sensitivity, specificity, precision, lift, ROC behavior, and other measures provide different views. No metric is universally best. The chosen measure should reflect whether the business cares most about ranking, calibration, rare-event detection, cost, or another outcome.
Visualization can expose problems that a single metric hides. Techniques such as SAS histograms and visual analysis help analysts see distributions, skew, outliers, separation, and residual patterns. A model-development workflow should use graphics as diagnostic evidence rather than decoration.
Inference and prediction answer different questions
Inferential statistics, explored further in inferential statistical reasoning, asks what can be concluded about relationships or populations. Predictive modeling asks how well the model performs on new observations. A model with interpretable significant coefficients is not automatically the best predictor, and a highly predictive model is not automatically a credible causal explanation.
Candidates should be able to state which objective they are optimizing. Business stakeholders often mix the two by asking why an outcome happens and whether it can be predicted. The analyst must clarify what the data and design can support before communicating a conclusion.
The November 2026 retirement makes transition planning part of the decision
Candidates who already have strong SAS 9 statistical experience may still choose A00-240 before its November 30, 2026 retirement, while others may prefer the newer applied-statistics path. The broader career context in SAS certification matters less than matching the credential to the tools and methods used in the candidate’s actual work.
Programming foundations from the historical SAS Base Programming and SAS Advanced Programming tracks can still help because reliable analysis starts with trustworthy data preparation. The best use of A00-240 material is to build statistical judgment that remains valuable after the exam code disappears.
A complete modeling exercise should connect statistical output to a business decision
Consider a response-modeling scenario in which a company wants to identify customers most likely to accept an offer. The analyst must define the target, choose an observation window, remove variables that leak future information, handle missing values, examine distributions, encode categories, split development and validation samples, fit candidate models, and compare performance. Each step changes what the final model means. The exercise is useful because it prevents regression from becoming a button-clicking task separated from data design.
Interpretation should then be translated into decision language. An odds ratio may show how a predictor relates to response while holding other variables constant, but the marketing team needs to know how that relationship changes targeting. Lift or rank ordering may matter more than raw accuracy when only a small segment can be contacted. If false positives are inexpensive and false negatives represent lost revenue, the operating threshold should reflect that asymmetry. Statistical metrics gain value only when they are connected to action.
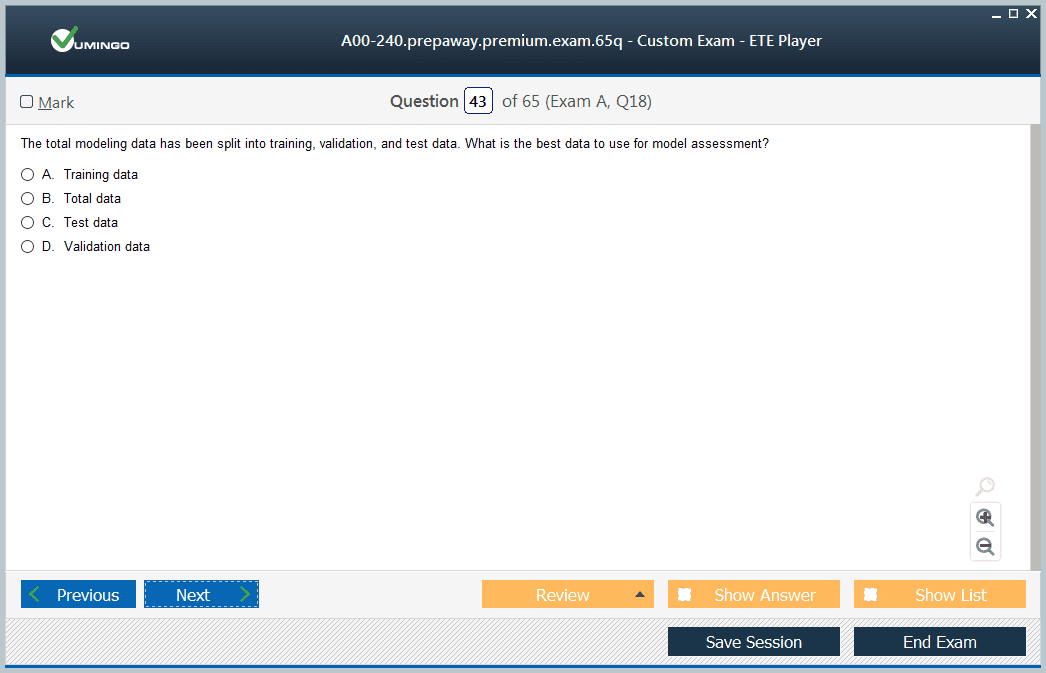
Validation is the safeguard against self-deception. A model that performs exceptionally on its development data may have learned noise, data leakage, or peculiarities of one period. Holdout performance, cross-validation where appropriate, residual or influence diagnostics, and stability checks across segments help reveal whether the pattern is likely to generalize. Analysts should also consider whether the data-generating process is changing, because even a well-validated model can decay after customer behavior, policy, or market conditions shift.
Communication completes the work. A business analyst should be able to explain what the model predicts, what it does not prove, which variables are most influential, how performance was measured, what threshold is recommended, and how the model should be monitored after deployment. These are durable skills that remain relevant whether a candidate takes A00-240 before its retirement or moves directly to the newer applied-statistics credential.
Analysts should also test whether a model behaves sensibly across important subgroups. Aggregate performance can hide poor calibration or weak discrimination for a region, product segment, age band, or other operationally meaningful cohort. Segment checks do not automatically imply separate models, but they reveal where one decision rule may create uneven outcomes or where more data is required before deployment.
Model monitoring begins before deployment by defining what will be watched later. Input distributions, missing rates, score distributions, outcome rates, calibration, and business performance can drift over time. If the organization cannot observe those signals, it will not know when the model is becoming unreliable. Statistical business analysis therefore extends beyond fitting the model; it includes a lifecycle for validating that the decision remains useful after conditions change.
Sampling design deserves attention because the observed data defines what the model can learn. Convenience samples, survivorship bias, policy-driven exclusions, and changing collection processes can make a model appear statistically strong while limiting where it can be used. Analysts should document the population represented by the training data and identify groups or future conditions that fall outside that evidence. A reliable model is one whose intended use matches the data that supported it.



 83% students found the test questions almost same