- Home
- Cisco Certifications
- 300-415 Implementing Cisco SD-WAN Solutions (ENSDWI) Dumps
Pass Cisco CCNP Enterprise 300-415 Exam in First Attempt Guaranteed!
Get 100% Latest Exam Questions, Accurate & Verified Answers to Pass the Actual Exam!
30 Days Free Updates, Instant Download!


300-415 Premium Bundle
- Premium File 417 Questions & Answers. Last update: Mar 31, 2026
- Training Course 112 Video Lectures
- Study Guide 874 Pages
Last Week Results!

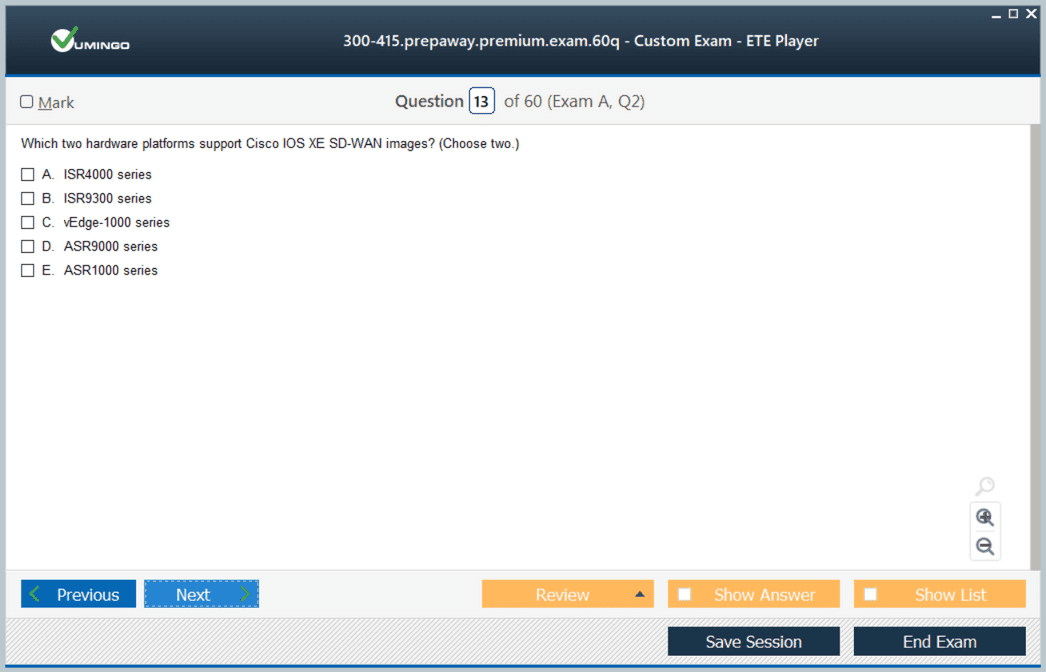
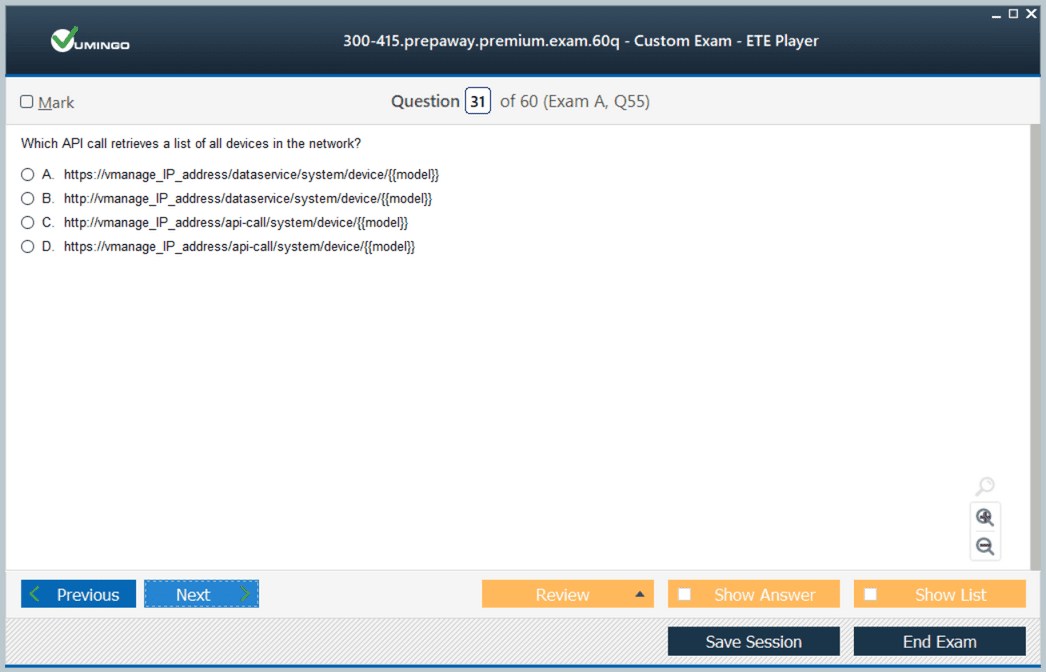
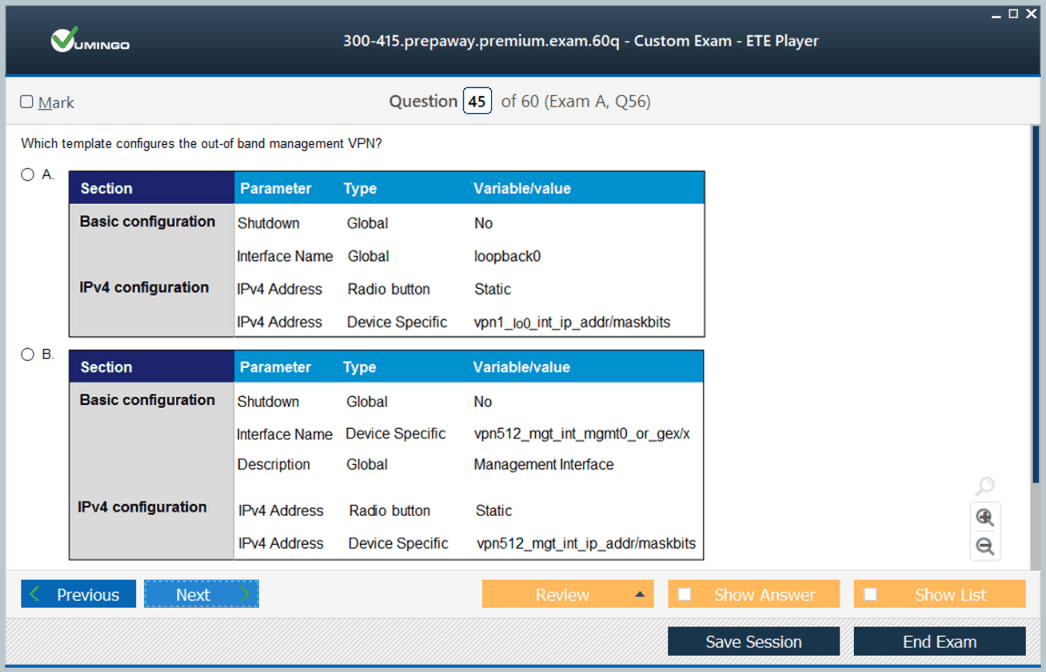
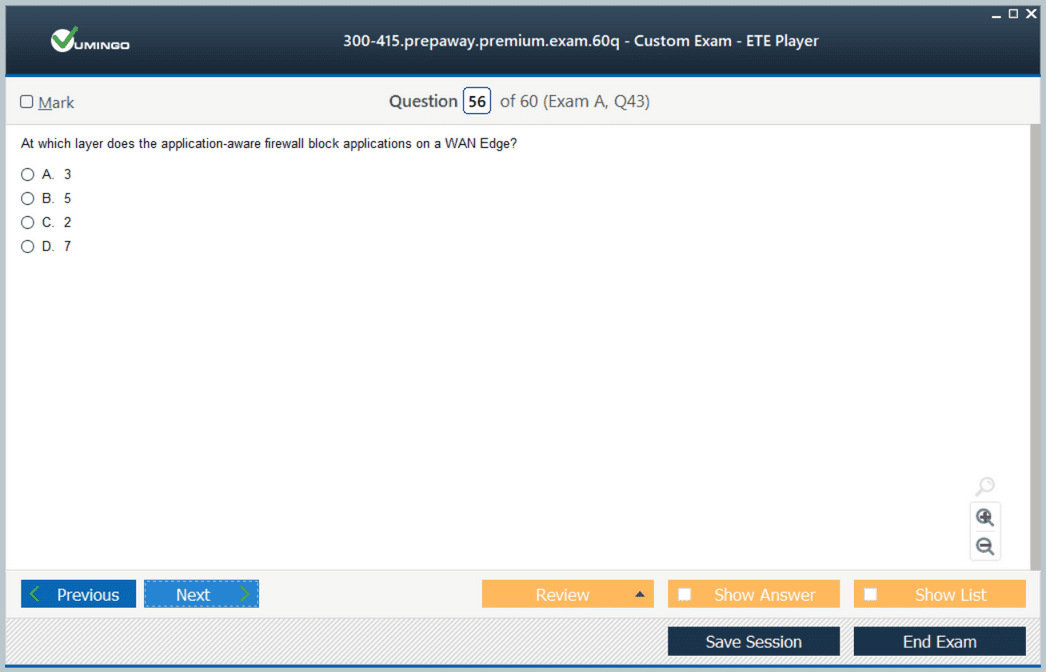
Includes question types found on the actual exam such as drag and drop, simulation, type-in and fill-in-the-blank.

Based on real-life scenarios similar to those encountered in the exam, allowing you to learn by working with real equipment.

Developed by IT experts who have passed the exam in the past. Covers in-depth knowledge required for exam preparation.
All Cisco CCNP Enterprise 300-415 certification exam dumps, study guide, training courses are Prepared by industry experts. PrepAway's ETE files povide the 300-415 Implementing Cisco SD-WAN Solutions (ENSDWI) practice test questions and answers & exam dumps, study guide and training courses help you study and pass hassle-free!
Step-by-Step Preparation for CCNP Enterprise ENSDWI 300-415
Software-Defined Wide Area Networking has become a cornerstone technology for modern enterprises, particularly those operating across multiple sites and cloud environments. By separating the control plane from the data plane, SD-WAN provides network administrators with centralized management and greater flexibility in routing traffic based on application requirements, link quality, and business priorities. This approach reduces reliance on traditional MPLS circuits, enabling cost optimization and improved bandwidth utilization across hybrid network architectures. Professionals preparing for the ENSDWI 300-415 exam need to understand how SD-WAN overlays interact with underlay networks, including MPLS, broadband, and LTE, and how dynamic path selection ensures optimal application performance and network resilience
Centralized orchestration is a key feature of SD-WAN that allows network policies to be consistently applied across all sites. Using controllers such as vManage, administrators can monitor network health, deploy configuration changes, and enforce security and QoS policies without manually configuring each device. This centralized approach simplifies network operations, reduces configuration errors, and ensures compliance with enterprise standards. Candidates for the ENSDWI exam should practice configuring policies for VPN segmentation, application-aware routing, and site-to-site connectivity to simulate real-world deployment scenarios and ensure operational readiness
Traffic prioritization and application-aware routing are critical for maintaining performance for business-critical applications. SD-WAN allows administrators to classify traffic, define path preferences, and implement failover strategies for applications such as VoIP, video conferencing, and SaaS services. Understanding how to measure latency, jitter, and packet loss, and how these metrics impact application performance, is essential for exam readiness. Candidates should simulate high-load conditions, test different routing policies, and analyze the effects of policy changes on traffic flows to develop a comprehensive understanding of SD-WAN performance optimization
Security integration in SD-WAN is another essential component. Modern SD-WAN solutions incorporate enterprise firewalls, IPS, URL filtering, and encrypted tunnels to protect data as it traverses multiple links and cloud connections. Administrators must understand how to configure security policies consistently across sites, monitor for potential threats, and enforce segmentation between networks. Advanced tasks include integrating threat intelligence feeds, coordinating policies across multi-site deployments, and testing the effectiveness of encryption and firewall configurations. Hands-on exercises in these areas reinforce practical skills necessary for ENSDWI 300-415 certification and real-world SD-WAN operations
Cloud connectivity and hybrid deployments are increasingly important in modern SD-WAN networks. Many enterprises use IaaS and SaaS platforms, and SD-WAN provides the flexibility to extend overlays to cloud environments efficiently. Candidates should practice configuring cloud on-ramp policies, validating connectivity to cloud resources, and testing path selection for optimal performance. Advanced scenarios include dynamic routing between SD-WAN and cloud networks, evaluating performance metrics under varying conditions, and troubleshooting connectivity failures. Multi-cloud simulation exercises help candidates develop the skills required to ensure resiliency, secure access, and efficient traffic flow across distributed environments
Monitoring, reporting, and analytics are integral for maintaining operational visibility and ensuring SLA compliance. SD-WAN solutions provide tools to collect network metrics, generate reports, and create dashboards for real-time insights into network performance. Professionals preparing for the ENSDWI exam should practice configuring monitoring alerts, correlating events with performance degradation, and validating QoS and policy adherence. Advanced exercises involve trend analysis, capacity planning, and root cause identification across multi-site networks, reinforcing the ability to respond to operational challenges proactively
High availability and disaster recovery are also core aspects of SD-WAN expertise. Candidates should be familiar with redundant controller configurations, failover mechanisms, and TLOC failover procedures to maintain uninterrupted network service. Exercises should simulate controller outages, multi-region redundancy, and split-brain prevention, providing a practical understanding of maintaining continuous connectivity in enterprise environments. Mastery of these scenarios ensures candidates can confidently address complex network failures and design resilient architectures
Automation and orchestration streamline SD-WAN operations in large-scale deployments. Candidates should practice automating device provisioning, policy deployment, monitoring, and software updates across distributed sites. Advanced exercises involve integrating automation with alerting and reporting systems, orchestrating failover procedures, and handling configuration drift. These activities prepare professionals to maintain operational efficiency and reduce manual intervention, which is critical for both certification scenarios and enterprise-scale SD-WAN management
Finally, end-to-end lab simulations and scenario-based exercises consolidate knowledge across all SD-WAN domains. Practicing combined tasks, such as controller configuration, edge provisioning, policy application, cloud integration, security enforcement, and monitoring under timed conditions, reinforces problem-solving skills and operational competence. Mastery of these integrated exercises ensures readiness for the ENSDWI 300-415 exam and the ability to manage complex enterprise SD-WAN deployments effectively, optimizing performance, security, and reliability across geographically distributed networks.
Core Components of Cisco SD-WAN Architecture
Cisco SD-WAN architecture is composed of four primary planes that work together to deliver a secure and efficient networking solution. The orchestration plane handles device authentication and initial connectivity setup, while the management plane provides centralized configuration, monitoring, and reporting. The control plane is responsible for routing decisions, secure key exchanges, and policy enforcement, whereas the data plane carries the actual user traffic and implements overlay tunnels between edge devices. A comprehensive understanding of these planes, their interactions, and deployment options across cloud and on-premises environments is essential. Candidates should be proficient in identifying the roles of orchestration, management, and control nodes, and understand how the data plane communicates within different network topologies, including multi-region deployments and integration with public cloud infrastructure.
Deployment of SD-WAN Controllers
Deploying controllers is a foundational aspect of Cisco SD-WAN implementation. This involves configuring controllers to ensure redundancy, high availability, and secure communication between components. Candidates should understand the process of deploying controllers in cloud-hosted environments as well as on-premises setups. This includes the creation and management of certificates, device lists, and authentication methods, which are critical to maintaining a secure control plane. Proper controller deployment also requires troubleshooting connectivity issues and validating the reliability of communication between orchestration, management, and control nodes. Realistic lab scenarios involving controller provisioning, failover testing, and certificate verification provide practical insight into operational best practices and prepare candidates for complex deployment situations.
WAN Edge Router Deployment and Configuration
WAN Edge routers serve as the interface between the enterprise network and the SD-WAN overlay. Candidates need to be familiar with zero-touch provisioning processes that allow routers to automatically register with the management platform. Configuring TLOCs, dynamic tunnels, and underlay-overlay connectivity are key components of ensuring seamless traffic flow. Additionally, the implementation of routing protocols and multicast support is required to maintain optimal network performance and resilience. Knowledge of Overlay Management Protocol (OMP) is critical for effective control plane operations, enabling policy enforcement and dynamic path selection based on real-time conditions. Practical exercises should include deploying multiple edge routers, verifying tunnel creation, and simulating high-traffic scenarios to observe routing behavior and failover capabilities.
Policy Configuration and Application-Aware Routing
Policies form the backbone of SD-WAN functionality, allowing administrators to define how traffic is routed, segmented, and prioritized. Control policies determine the behavior of routing and tunneling, while data policies manage application flows and traffic shaping. End-to-end segmentation ensures separation of services across VPNs, while application-aware routing enables traffic to follow the most efficient path based on performance metrics. Direct Internet access policies allow branch devices to bypass central hubs for optimized connectivity to cloud services. Candidates should gain hands-on experience creating and applying policies, validating the effectiveness of routing decisions, and troubleshooting scenarios where policy conflicts or misconfigurations may occur. Understanding policy propagation, priority handling, and conflict resolution is essential for operational readiness and is a major focus area in the exam.
This section establishes a strong foundational understanding of SD-WAN concepts, architecture, deployment, and policy management that is critical for the 300-415 ENSDWI exam. Mastery of these elements provides a framework for candidates to build advanced operational skills, troubleshoot real-world scenarios, and ensure enterprise network reliability.
Security Features in Cisco SD-WAN
Security is a critical component of SD-WAN deployment, and mastering these concepts is essential for ENSDWI 300-415 exam preparation. Cisco SD-WAN integrates several security mechanisms to protect data in transit, ensure secure communication between devices, and enforce enterprise policies across branches. Candidates should understand how to implement the application-aware enterprise firewall, intrusion prevention systems, URL filtering, and TrustSec policies. Configuring these features involves mapping policies to specific VPNs or application traffic, validating rule enforcement, and monitoring for anomalies. Advanced exercises include simulating attacks to test firewall responses, analyzing logs for policy violations, and validating encryption and authentication across edge devices. Hands-on experience with configuring segmented traffic flows ensures candidates can maintain a secure network while meeting operational requirements.
Quality of Service and Performance Optimization
The ability to implement Quality of Service is vital for SD-WAN environments to guarantee application performance and efficient bandwidth utilization. Candidates must be able to configure traffic shaping, scheduling, queuing, marking, and adaptive QoS to optimize critical applications. Understanding App-QoE is also important, as it allows for monitoring and adjusting network paths based on performance metrics, latency, jitter, and packet loss. Techniques such as TCP optimization, data redundancy elimination, and forward error correction should be practiced in lab environments. Simulating high-traffic scenarios helps candidates analyze the impact of QoS policies and ensure that critical applications maintain performance standards. Knowledge of these techniques is essential for passing scenario-based questions in the exam.
Monitoring and Management Using vManage
Centralized management through vManage provides visibility, control, and operational efficiency in SD-WAN deployments. Candidates should understand how to configure authentication, device monitoring, and reporting functions within vManage. Skills in managing software images, monitoring overlay network health, and using REST APIs for automated monitoring are crucial. Candidates should practice generating performance reports, analyzing network trends, and configuring alerts for anomalies. Familiarity with troubleshooting dashboards and understanding log correlation across control and data planes will help candidates identify and resolve network issues efficiently. Management proficiency ensures operational readiness for real-world deployments and is a critical component of ENSDWI 300-415 exam assessment.
Troubleshooting SD-WAN Networks
Troubleshooting is an integral part of the 300-415 exam, requiring candidates to identify and resolve complex networking issues. Key areas include verifying control and data plane connectivity, examining TLOC and tunnel states, and resolving overlay routing problems. Candidates should practice using diagnostic commands and interpreting outputs to identify misconfigurations or connectivity failures. Simulating network failures, packet drops, or misrouted traffic helps reinforce troubleshooting skills. Understanding error messages, certificate validation failures, and policy conflicts is essential for both operational tasks and exam scenarios. Developing a systematic troubleshooting approach ensures that candidates can quickly isolate issues and maintain network reliability.
Controller and Router High Availability
High availability is a central concept in SD-WAN deployment, ensuring that critical services remain operational under failure conditions. Candidates must configure redundancy for controllers and WAN Edge routers, validate failover mechanisms, and test recovery processes. Understanding clustering, load balancing, and failover behavior in both control and data planes is essential. Practical exercises include replicating controller configurations across sites, validating seamless switchover, and simulating WAN link failures to observe routing adjustments. Proficiency in high availability ensures network resiliency and prepares candidates for operational challenges reflected in the ENSDWI 300-415 exam.
Advanced Routing and Overlay Management Protocol
Overlay Management Protocol forms the backbone of SD-WAN routing and traffic management. Candidates should understand how OMP propagates routes, applies policies, and maintains routing tables across multiple edge devices. Advanced routing tasks include configuring path selection criteria, implementing application-aware routing, and understanding route redistribution between overlay and underlay networks. Candidates should practice configuring dynamic tunnel selection, path remediation, and multicast traffic handling. Realistic lab exercises that involve multiple sites, route preferences, and policy conflicts help build proficiency in managing overlay networks effectively. These skills are heavily tested in the ENSDWI exam.
Cloud Integration and Multi-Region Deployments
Cloud connectivity is a growing requirement in modern SD-WAN deployments. Candidates should be familiar with integrating Cisco SD-WAN with cloud providers, SaaS applications, and multi-region fabrics. This includes understanding Cloud OnRamp features, optimizing application routing to cloud endpoints, and implementing secure branch-to-cloud connectivity. Advanced exercises involve validating connectivity across multiple cloud regions, troubleshooting performance bottlenecks, and ensuring redundancy for cloud resources. Knowledge of cloud integration ensures candidates can manage enterprise-scale environments that span multiple geographic regions, which is critical for real-world operations and exam scenarios.
Policy Segmentation and VPN Management
Policy segmentation allows administrators to isolate traffic for security, performance, or compliance purposes. Candidates should practice configuring VPN segmentation, applying control and data policies, and managing policy precedence. Understanding end-to-end segmentation and its impact on routing, application behavior, and security is essential. Hands-on exercises include creating segmented networks, monitoring policy effectiveness, and troubleshooting misapplied rules. VPN management also involves handling overlapping subnets, route redistribution, and policy conflicts, which are common topics in the ENSDWI 300-415 exam.
Simulation of Enterprise Deployment Scenarios
To prepare effectively for the 300-415 exam, candidates should simulate enterprise deployment scenarios that combine all core SD-WAN functionalities. Lab exercises should include controller and router deployment, policy configuration, QoS implementation, security enforcement, high availability testing, and cloud connectivity. These simulations help candidates integrate multiple features into cohesive operational workflows and reinforce problem-solving skills. Practicing complex scenarios ensures readiness for exam questions that test practical deployment knowledge rather than just theoretical concepts.
Continuous Monitoring and Optimization
Ongoing monitoring and optimization are vital for sustaining enterprise SD-WAN performance. Candidates should configure monitoring dashboards, analyze real-time traffic patterns, and tune policies based on performance metrics. Techniques such as identifying congestion points, adjusting traffic paths, and fine-tuning QoS settings are crucial. Advanced monitoring also includes using API-based automation to collect metrics and trigger alerts, enabling proactive network management. Mastery of monitoring and optimization prepares candidates for operational responsibilities and aligns with the practical focus of the ENSDWI 300-415 exam.
Integration with Existing Enterprise Networks
Candidates must understand how to integrate SD-WAN into existing enterprise infrastructures that include traditional routers, firewalls, and legacy WAN connections. This involves configuring interoperability, route redistribution, and policy harmonization between SD-WAN and non-SD-WAN networks. Exercises should focus on managing mixed traffic flows, validating connectivity, and ensuring consistent security policies. This knowledge ensures that candidates can deploy SD-WAN in complex, heterogeneous environments and meet real-world enterprise requirements, which is a central objective of the ENSDWI exam.
Operational Readiness and Exam Strategy
Preparing for ENSDWI 300-415 requires a balance between theoretical knowledge and practical application. Candidates should practice timed lab exercises that simulate real-world SD-WAN deployments, focusing on troubleshooting, performance optimization, and multi-site integration. Reviewing logs, validating policy enforcement, and performing end-to-end network tests help consolidate knowledge. Familiarity with all exam topics, including SD-WAN architecture, controller and router deployment, policies, security, QoS, cloud integration, and monitoring, is critical for achieving success. Practical readiness ensures that candidates can apply their skills confidently under exam conditions while demonstrating operational competence.
Advanced Troubleshooting Techniques for SD-WAN
Troubleshooting is a critical skill for professionals preparing for the ENSDWI 300-415 exam. Candidates must be proficient in diagnosing issues across the control, data, and management planes. This includes validating overlay tunnels, monitoring TLOC states, and ensuring proper route propagation via Overlay Management Protocol. Practical exercises should simulate common network failures, misconfigurations, and certificate validation errors. Candidates should also practice using diagnostic commands to verify connectivity between controllers and WAN Edge devices, examine policy enforcement, and troubleshoot multicast traffic. Understanding how to interpret log files from vManage and other SD-WAN components is essential to efficiently resolve operational issues and meet enterprise service expectations.
Multi-Site Deployment Considerations
Managing SD-WAN across multiple geographic locations is a core component of the 300-415 exam. Candidates need to configure controllers and edge devices to operate cohesively across sites while maintaining secure and optimized traffic flows. Exercises should include implementing multi-region routing, validating policy consistency, and ensuring redundancy for critical services. Advanced tasks involve testing failover scenarios, monitoring latency between sites, and resolving route conflicts that may occur due to overlapping IP addresses or misaligned policies. Practicing these scenarios prepares candidates for real-world deployments and exam questions that require an understanding of multi-site SD-WAN operations and enterprise-scale network management.
Integration with Cloud and SaaS Applications
Cloud integration is increasingly important in enterprise SD-WAN environments. Candidates should focus on configuring Cloud OnRamp features to optimize connectivity to SaaS applications, IaaS platforms, and multi-cloud infrastructures. Practical exercises include verifying traffic steering to cloud resources, ensuring secure encryption, and applying policies that prioritize business-critical applications. Candidates should simulate high-traffic conditions to evaluate performance and troubleshoot routing issues when cloud endpoints become unavailable. Understanding the interactions between cloud connectivity, local breakout strategies, and overlay tunnels ensures candidates can implement robust SD-WAN architectures across hybrid cloud environments, which is a significant aspect of ENSDWI exam scenarios.
Automation and API-Based Management
Automation enhances operational efficiency and reduces human error in SD-WAN environments. Candidates should be familiar with using vManage APIs to automate tasks such as device provisioning, policy deployment, software image upgrades, and network monitoring. Practical exercises include creating scripts for recurring tasks, validating automated workflows, and simulating configuration drift scenarios. Advanced scenarios involve integrating automation with alerting systems, orchestrating failover procedures, and ensuring consistent execution across multiple sites. Mastery of automation and API-based management is crucial for demonstrating practical competence in the exam and for effective enterprise network operations.
Policy Optimization and Application-Aware Routing
Optimizing SD-WAN policies and application-aware routing is essential for ensuring performance and reliability. Candidates should practice configuring data policies, control policies, and VPN segmentation to match application requirements. Techniques such as dynamic path selection, SLA monitoring, and traffic steering based on performance metrics should be tested in lab environments. Understanding how to balance policy priorities, prevent conflicts, and validate routing decisions under varying network conditions is critical. Advanced exercises include simulating congestion, testing failover paths, and verifying end-to-end application performance to prepare for real-world scenarios and exam questions focused on network optimization.
Security and Compliance Monitoring
Ensuring security and compliance is a continuous responsibility in SD-WAN operations. Candidates must configure centralized logging, monitor authentication events, and enforce encryption policies across edge devices and controllers. Practical exercises include simulating security breaches, analyzing log data, and validating firewall rules and URL filtering. Advanced tasks involve auditing policy compliance, monitoring application traffic for anomalies, and integrating security alerts with operational workflows. Understanding regulatory requirements and implementing proactive security measures ensures that candidates can maintain enterprise network integrity and is a key focus area in ENSDWI exam preparation.
High Availability and Resiliency Planning
High availability and resiliency are critical in enterprise SD-WAN deployments. Candidates should practice configuring redundant controllers, clustered WAN Edge devices, and multi-path overlay tunnels to ensure uninterrupted service. Exercises include simulating link failures, validating failover behavior, and testing load balancing between redundant devices. Advanced scenarios involve planning multi-region redundancy, implementing disaster recovery strategies, and monitoring network health to detect potential disruptions. Proficiency in high availability ensures candidates can maintain service continuity under failure conditions and aligns with the operational challenges evaluated in the exam.
Monitoring and Performance Analysis
Continuous monitoring and performance analysis are vital for effective SD-WAN management. Candidates should configure dashboards in vManage, track metrics such as bandwidth utilization, latency, and packet loss, and identify potential bottlenecks. Practical exercises include simulating high-traffic scenarios, analyzing application performance, and tuning policies to maintain optimal service levels. Advanced analysis involves correlating data across multiple sites, integrating performance metrics with alerting systems, and validating improvements after policy adjustments. Mastery of monitoring ensures operational readiness and prepares candidates to demonstrate problem-solving skills during the exam.
Scenario-Based Lab Simulations
Hands-on lab simulations that combine multiple SD-WAN concepts are essential for comprehensive exam preparation. Candidates should practice end-to-end deployment exercises including controller configuration, edge router provisioning, policy application, security enforcement, QoS implementation, high availability testing, and cloud integration. Scenario-based exercises reinforce problem-solving capabilities, enable practical application of theoretical concepts, and provide familiarity with real-world operational challenges. Iterative testing and self-assessment in lab environments help consolidate knowledge, develop troubleshooting skills, and build confidence for exam scenarios requiring integrated operational expertise.
Multi-Protocol and Interoperability Management
Candidates must understand how SD-WAN interacts with other protocols and existing enterprise infrastructure. This includes managing interactions with routing protocols, legacy WAN connections, and security appliances. Exercises should focus on verifying route redistribution, ensuring policy compatibility, and testing interoperability between SD-WAN and traditional network devices. Advanced practice scenarios involve resolving conflicts, optimizing traffic flows across heterogeneous networks, and maintaining consistent policy enforcement. Mastery of multi-protocol integration ensures readiness for complex deployment scenarios assessed in the ENSDWI exam.
Change Management and Operational Best Practices
Effective change management ensures stability and reliability in SD-WAN networks. Candidates should practice documenting configuration changes, applying updates methodically, and validating policies after modifications. Exercises include simulating software upgrades, performing rollback procedures, and coordinating updates across multiple sites. Understanding operational best practices such as version control, backup strategies, and scheduled maintenance is critical. Developing a structured approach to change management ensures candidates can maintain operational continuity while preparing for scenario-based exam questions that test practical network administration skills.
End-to-End Operational Integration
Comprehensive preparation for the ENSDWI exam requires integrating all learned domains into cohesive operational workflows. Candidates should practice coordinating deployment, configuration, policy management, monitoring, troubleshooting, high availability, security, automation, cloud integration, and multi-site operations in combined scenarios. Timed exercises simulating real-world enterprise challenges reinforce operational competence and enhance problem-solving abilities. Mastery of end-to-end integration ensures readiness for the practical aspects of the 300-415 exam, demonstrating the ability to manage complex SD-WAN environments efficiently and effectively.
Advanced Policy Configuration and Segmentation
Policy configuration is a central skill for mastering the ENSDWI 300-415 exam. Candidates should understand how to define, apply, and troubleshoot control policies, data policies, and application-aware routing policies. Practical exercises include creating segmentation policies for multiple VPNs, enforcing security zones, and simulating different traffic flows to verify correct policy application. Advanced exercises involve testing dynamic path selection, integrating QoS policies with application prioritization, and validating end-to-end policy enforcement under varying network conditions. Candidates should also practice troubleshooting policy conflicts, verifying route propagation across multiple sites, and monitoring real-time traffic to ensure policies meet enterprise performance and security requirements
Controller and Device Lifecycle Management
Managing the lifecycle of controllers and edge devices is essential for enterprise SD-WAN environments. Candidates should practice onboarding new devices using Zero Touch Provisioning, validating device certificates, and integrating devices into existing orchestration structures. Exercises include simulating firmware upgrades, verifying device synchronization, and troubleshooting registration issues. Advanced scenarios involve decommissioning devices, managing redundant controller clusters, and ensuring seamless failover during maintenance. Understanding lifecycle processes ensures operational continuity and prepares candidates for exam scenarios that assess practical skills in device management, troubleshooting, and configuration validation
Multi-Cloud Connectivity and Optimization
The ENSDWI 300-415 exam evaluates the candidate’s ability to optimize connectivity to multiple cloud platforms. Candidates should configure cloud on-ramp policies for SaaS, IaaS, and multi-cloud environments, ensuring secure, efficient, and reliable access. Exercises include testing path selection, evaluating latency and packet loss, and simulating traffic redirection during outages. Advanced exercises involve applying application-aware routing to cloud resources, validating SLA compliance, and troubleshooting cloud connectivity issues. Candidates should also practice configuring local breakouts, optimizing underlay paths, and monitoring performance to maintain high-quality service delivery across hybrid and multi-cloud environments
Security Implementation and Threat Mitigation
Security is a critical component of the ENSDWI exam. Candidates must configure integrated security features such as enterprise firewalls, intrusion prevention systems, URL filtering, and segmentation policies across SD-WAN devices. Practical exercises should include simulating security threats, validating firewall rules, and testing policy enforcement across multiple edge devices. Advanced exercises involve monitoring for anomalies, managing trust relationships, integrating security alerts with operational workflows, and implementing adaptive security measures to maintain compliance. Candidates should also practice encryption validation, certificate management, and secure communication between controllers and edge devices to ensure robust protection in enterprise environments
Quality of Service and Performance Tuning
Optimizing QoS is necessary for managing application performance and meeting SLA requirements. Candidates should configure QoS policies including shaping, queuing, marking, and prioritization across multiple paths and VPNs. Exercises include simulating congestion, analyzing traffic flow, and adjusting policies to improve application performance. Advanced exercises involve integrating App-QoE, DRE, and FEC techniques, validating throughput for critical applications, and testing policy impact under high-load conditions. Candidates should practice measuring latency, jitter, and packet loss while tuning policies to ensure consistent service quality across complex SD-WAN deployments
High Availability and Resiliency Strategies
Ensuring high availability and resiliency is a critical requirement for enterprise networks. Candidates should practice configuring redundant vSmart controllers, clustered WAN Edge devices, and failover mechanisms across sites. Exercises include simulating link and controller failures, validating failover procedures, and monitoring state synchronization. Advanced exercises involve testing multi-region redundancy, ensuring consistency in policy propagation, simulating disaster recovery scenarios, and managing split-brain conditions. Mastery of high availability configurations ensures candidates are prepared for real-world challenges and exam questions focused on network resilience
Troubleshooting Advanced Overlay Networks
Overlay network troubleshooting is central to the ENSDWI exam. Candidates should practice diagnosing TLOC failures, OMP route propagation issues, and VPN connectivity problems. Exercises include validating overlay tunnels, testing dynamic routing decisions, and analyzing packet capture data. Advanced exercises involve simulating multi-site routing conflicts, troubleshooting multicast overlay issues, resolving underlay-to-overlay connectivity problems, and correlating log data from controllers and edge devices. Proficiency in troubleshooting overlays ensures candidates can quickly resolve operational issues and demonstrates practical competence for the exam
Automation and Orchestration in SD-WAN
Automation and orchestration improve operational efficiency and consistency across SD-WAN deployments. Candidates should practice using APIs and scripts to automate device onboarding, policy deployment, and monitoring tasks. Exercises include validating automated workflows, simulating configuration drift, and ensuring consistency across multiple sites. Advanced exercises involve integrating orchestration with alert systems, automating failover procedures, scheduling updates, and maintaining audit logs for changes. Mastery of automation demonstrates operational readiness and enhances the ability to manage complex SD-WAN environments efficiently
End-to-End Lab Scenarios
Comprehensive lab scenarios consolidate learning across all domains. Candidates should practice end-to-end SD-WAN deployments including controller setup, edge router provisioning, policy configuration, cloud integration, security implementation, QoS optimization, high availability testing, and troubleshooting. Timed simulations help candidates build operational efficiency, reinforce problem-solving skills, and prepare for scenario-based exam questions. Advanced lab exercises should combine multiple challenges to simulate real-world enterprise networks, ensuring candidates gain hands-on experience and confidence in managing complete SD-WAN solutions
Monitoring, Reporting, and Analytics
Continuous monitoring and analytics are essential for maintaining network performance and security. Candidates should configure dashboards, collect metrics on latency, jitter, packet loss, and throughput, and interpret reports from vManage and other monitoring tools. Exercises include validating alert thresholds, analyzing historical trends, and identifying potential network bottlenecks. Advanced exercises involve correlating data across multiple sites, performing root cause analysis, and optimizing configuration based on performance metrics. Mastery of monitoring and analytics ensures candidates are prepared for operational challenges and practical exam requirements
Interoperability with Legacy Networks
Managing SD-WAN in environments with existing legacy networks is a key skill for the ENSDWI exam. Candidates should practice integrating SD-WAN with traditional MPLS, VPNs, and routing protocols. Exercises include route redistribution, conflict resolution, and verifying seamless connectivity between SD-WAN and non-SD-WAN segments. Advanced exercises involve validating policy consistency, troubleshooting interoperability issues, and maintaining network security while integrating heterogeneous networks. Proficiency in legacy integration ensures readiness for enterprise deployments and complex exam scenarios
Scenario-Based Problem Solving
Scenario-based problem solving combines all learned concepts into practical exercises. Candidates should practice timed labs that integrate controller deployment, edge provisioning, policy configuration, QoS tuning, security implementation, cloud integration, high availability, troubleshooting, and monitoring. Advanced scenarios involve simulated outages, policy conflicts, and multi-site coordination challenges. Iterative practice with scenario-based exercises builds confidence, reinforces operational skills, and ensures candidates can apply theoretical knowledge to real-world challenges, aligning directly with the practical objectives of the ENSDWI 300-415 exam
Advanced Cloud Integration and SD-WAN Connectivity
Cloud integration forms the backbone of modern enterprise SD-WAN solutions and is a critical topic in the ENSDWI 300-415 exam. Candidates need to understand how SD-WAN overlays extend to multiple cloud environments, including infrastructure as a service, software as a service, and hybrid deployments. Exercises should include configuring cloud on-ramp policies, validating secure connectivity, and testing path selection for optimized performance. Advanced tasks involve implementing dynamic routing between SD-WAN and cloud networks, evaluating latency and throughput, and troubleshooting connectivity failures. Simulating multi-cloud environments helps ensure resiliency, secure access, and efficient traffic distribution across geographically dispersed networks
Candidates should also focus on integrating SD-WAN with cloud-native services and applications. This includes prioritizing business-critical applications, enforcing compliance policies, and managing encrypted communications. Understanding how to leverage SD-WAN features to optimize cloud connectivity while maintaining visibility into traffic flows and application performance is essential. Advanced exercises include evaluating cloud service latency, monitoring throughput variability, and ensuring seamless failover between on-premises and cloud resources. Preparing with these scenarios ensures candidates can apply practical knowledge during the exam
End-to-End Troubleshooting Scenarios
Troubleshooting across SD-WAN environments is a core skill tested in the ENSDWI 300-415 exam. Candidates should practice identifying and resolving problems across controllers, edge devices, and overlay networks. Exercises include analyzing logs, performing packet captures, verifying transport location (TLOC) status, and diagnosing OMP route propagation issues. Advanced scenarios include multi-site outages, intermittent packet loss, policy conflicts, and degraded service performance. Integrating monitoring tools to track performance, validate failover processes, and confirm SLA compliance is crucial. Hands-on troubleshooting reinforces operational competency and ensures preparedness for scenario-based questions that assess practical decision-making
Advanced troubleshooting also involves understanding the interaction between SD-WAN overlays and underlying network transport, identifying misconfigurations, and diagnosing cross-region connectivity issues. Candidates should simulate real-world conditions with multiple failure points to validate their ability to restore services efficiently. Exercises that combine controller failures, edge router misconfigurations, and cloud connectivity issues provide a comprehensive testing environment for honing problem-solving skills
Performance Optimization Techniques
Optimizing SD-WAN performance is a vital aspect of the ENSDWI 300-415 exam. Candidates must configure application-aware routing, implement quality of service mechanisms, and set traffic prioritization policies. Exercises include testing bandwidth allocation, applying traffic shaping, evaluating jitter and latency, and simulating high-load traffic scenarios. Advanced exercises involve deploying App-QoE, data redundancy elimination, forward error correction, and adaptive QoS for application performance enhancement. Correlating performance metrics with policy configurations allows candidates to identify bottlenecks and optimize end-to-end network operations
Candidates should also explore traffic engineering techniques for improving throughput and reducing latency across WAN links. This includes implementing dynamic path selection, evaluating overlay link utilization, and balancing traffic across multiple connections. Exercises should focus on creating performance baselines, measuring improvements from configuration changes, and validating application responsiveness under varying network conditions. Mastery of these techniques ensures candidates can maintain predictable application performance and meet service-level agreements
Multi-Site and Multi-Region SD-WAN Management
Managing distributed SD-WAN deployments is critical for large-scale enterprises and is tested in the ENSDWI 300-415 exam. Candidates should configure multi-site topologies, ensuring consistent policy enforcement, seamless connectivity, and redundancy across regions. Exercises include synchronizing configurations, validating VPN segmentation, testing high-availability setups, and troubleshooting inter-site communication. Advanced exercises involve hierarchical control policy implementation, multi-region orchestration, and resolving cross-region route conflicts. Proficiency in multi-site management equips candidates to handle complex deployments efficiently
Advanced exercises should also focus on monitoring inter-site traffic, validating overlay stability, and optimizing path selection across different regions. Candidates should practice scaling policies for multiple sites, automating configuration distribution, and maintaining synchronization between primary and backup sites. Realistic lab scenarios with diverse network conditions prepare candidates for operational challenges they may encounter in exam simulations
Integrated Security and Compliance Practices
Security is a central concern in SD-WAN management. Candidates should implement enterprise firewall policies, intrusion prevention, URL filtering, and network segmentation across SD-WAN infrastructure. Exercises include validating encrypted tunnels, testing security policies, and monitoring for potential breaches. Advanced exercises involve integrating threat intelligence, performing simulated attack mitigation, enforcing compliance policies, and coordinating security across multiple sites. Candidates should audit configurations, verify trust relationships, and apply corrective actions to ensure full protection and operational integrity
Security exercises should extend to endpoint validation, access control verification, and anomaly detection across overlay networks. Candidates should simulate attacks, analyze logs for abnormal behavior, and validate policy responses. Understanding how to integrate security monitoring with performance optimization and routing policies reinforces comprehensive network management skills
Automation and Orchestration Workflows
Automation is crucial for managing enterprise SD-WAN deployments and is a key topic in the ENSDWI 300-415 exam. Candidates should develop scripts for device provisioning, policy deployment, monitoring, and software updates. Exercises include scheduling tasks, validating workflows, and maintaining consistency across distributed sites. Advanced exercises involve integrating automation with alerting systems, orchestrating failover procedures, handling configuration drift, and troubleshooting automated processes. Practicing full automation workflows reinforces operational efficiency and reduces manual intervention
Advanced automation scenarios should include integrating SD-WAN monitoring with automated alert systems, dynamically adjusting routing policies based on real-time performance data, and validating automated failover across multiple sites. Candidates should simulate disruptions and observe how automated processes maintain connectivity and service continuity
Application-Level Routing and Traffic Engineering
Application-level routing ensures critical business applications receive optimal network paths. Candidates should configure application-aware routing policies, validate SLA compliance, and simulate traffic steering. Exercises include monitoring latency, packet loss, and ensuring application continuity. Advanced exercises involve dynamic traffic redistribution, analytics-based decision-making, troubleshooting routing anomalies, and ensuring uninterrupted application performance. Mastery of application-level routing allows candidates to manage traffic efficiently and maintain predictable performance under varying network conditions
Advanced exercises also include testing failover scenarios for critical applications, validating route redistribution between regions, and ensuring policy compliance with multi-site overlays. Candidates should simulate congestion, evaluate policy impact, and refine routing strategies to improve resilience and responsiveness
High Availability and Disaster Recovery Configurations
High availability and disaster recovery are essential for enterprise SD-WAN deployments. Candidates should configure redundant controllers, implement failover mechanisms, and test continuity across edge devices. Exercises include simulating controller outages, validating TLOC failover, and monitoring device synchronization. Advanced exercises involve multi-region redundancy, disaster recovery simulations, split-brain prevention, and policy validation during failover events. Proficiency in these areas ensures uninterrupted service and SLA compliance
Advanced scenarios include testing failover under heavy traffic, evaluating state synchronization across devices, and implementing multi-tier redundancy strategies. Candidates should practice restoring connectivity after simulated site failures and validating network stability under stress conditions
Monitoring, Reporting, and Analytics
Monitoring provides critical insights into network performance and reliability. Candidates should configure dashboards, collect metrics, and generate analysis reports. Exercises include measuring latency, jitter, packet loss, and throughput across multiple sites, correlating events with alerts, and validating SLA adherence. Advanced exercises involve trend analysis, proactive alerting, capacity planning, and root cause identification. Candidates should integrate monitoring insights with operational workflows to optimize performance and ensure continuous compliance
Monitoring should extend to real-time traffic analysis, predictive modeling, and automated reporting. Candidates should practice correlating performance data across controllers and edge devices to make informed operational decisions. Scenario-based exercises enhance understanding of complex network behaviors and prepare candidates for practical exam challenges
Integrated End-to-End Lab Scenarios
Comprehensive labs consolidate SD-WAN knowledge across all domains. Candidates should simulate deployments including controller configuration, edge provisioning, policy enforcement, QoS, security, cloud integration, multi-site management, troubleshooting, and monitoring. Advanced labs combine multiple challenges into timed scenarios reflecting real-world complexity. Candidates should practice iterative problem-solving, performance validation, failover testing, and policy adjustment. Mastery of integrated labs ensures operational readiness, reinforces learning, and aligns with ENSDWI 300-415 exam objectives
Advanced lab exercises should simulate multi-cloud integration, high-availability failovers, dynamic routing conflicts, and performance bottlenecks. Candidates should coordinate multiple tasks concurrently to mirror operational realities and reinforce multi-domain expertise
Scenario-Based Operational Excellence
Scenario-based exercises evaluate a candidate’s ability to handle complex SD-WAN environments under operational conditions. Candidates should perform tasks including controller, edge, and policy troubleshooting, cloud integration, application-level routing, and high-availability validation. Advanced exercises include simulated outages, multi-site coordination, real-time traffic optimization, and resolving dynamic routing conflicts. These exercises build confidence, reinforce problem-solving, and prepare candidates for practical exam scenarios
Advanced scenarios also incorporate simultaneous failures, cross-region policy adjustments, and security threat mitigation. Candidates should practice decision-making under time constraints, evaluate impact on SLA adherence, and refine response strategies to achieve operational excellence
Continuous Improvement and Best Practices
Best practices in SD-WAN deployment and management ensure scalable, secure, and efficient networks. Candidates should focus on architecture design, policy enforcement, performance monitoring, and security compliance. Exercises include validating configurations, optimizing resource allocation, documenting procedures, and reviewing network topologies. Advanced exercises involve auditing performance, analyzing simulated failures, refining automation workflows, and integrating monitoring for proactive management. Mastery of best practices equips candidates to manage enterprise-grade SD-WAN solutions effectively and prepares them fully for the ENSDWI 300-415 exam
Final Words
The ENSDWI 300-415 exam emphasizes the practical application of Cisco SD-WAN technologies in complex enterprise networks, and mastering its content requires both theoretical knowledge and extensive hands-on experience. Candidates must be proficient in deploying and managing SD-WAN controllers and edge devices, configuring secure overlays, and implementing advanced routing policies to ensure reliable connectivity across distributed sites. Understanding how to integrate SD-WAN with cloud platforms, including IaaS and SaaS environments, is essential for achieving optimal application performance and maintaining resilient network operations. Real-world simulation of multi-cloud connectivity, traffic prioritization, and failover mechanisms helps solidify these competencies, preparing candidates for the scenario-based challenges posed by the exam
Advanced troubleshooting skills are fundamental for exam readiness and effective network management. Candidates must be able to analyze logs, monitor TLOCs, diagnose OMP route propagation issues, and resolve service degradation across complex topologies. Multi-site and multi-region deployment scenarios reinforce the ability to manage distributed networks, implement hierarchical control policies, and resolve routing conflicts, ensuring operational continuity even under high-demand conditions. Scenario-based exercises enhance problem-solving skills, enabling candidates to respond efficiently to outages, policy misconfigurations, and performance bottlenecks
Performance optimization is another critical domain in the ENSDWI 300-415 exam. Candidates are expected to configure application-aware routing, implement quality of service mechanisms, and manage traffic dynamically to meet business requirements. Proficiency in monitoring network metrics, analyzing latency and jitter, and applying adaptive QoS strategies ensures that applications receive predictable performance even under variable network loads. Advanced skills in redundancy elimination, forward error correction, and traffic shaping reinforce the ability to optimize WAN utilization and maintain consistent user experiences across the enterprise
Security and compliance are integral components of SD-WAN management. Candidates should implement enterprise firewalls, intrusion prevention, URL filtering, and secure overlay policies. Auditing configurations, validating encrypted tunnels, and integrating threat intelligence ensures proactive protection of critical assets. Multi-site coordination of security policies and scenario-based testing of potential breaches provide practical experience in maintaining operational integrity across the network
Automation and orchestration workflows reduce operational complexity and increase efficiency. Candidates must develop scripts for provisioning, monitoring, policy deployment, and software updates. By simulating automated failover procedures, configuration drift correction, and end-to-end monitoring, candidates gain insight into scalable network management practices. Integrating automation with analytics, alerting, and reporting ensures consistent execution and operational oversight
Ultimately, mastery of multi-site SD-WAN management, cloud integration, traffic engineering, high availability, and scenario-based troubleshooting equips candidates to handle complex enterprise networks with confidence. Comprehensive lab simulations that combine controllers, edge devices, cloud connectivity, security policies, performance tuning, and failover exercises build practical competence, ensuring readiness for the ENSDWI 300-415 exam. Candidates who integrate these skills are not only prepared for certification but also capable of managing enterprise SD-WAN deployments effectively, maintaining service continuity, and optimizing application performance across geographically dispersed environments. These capabilities form the foundation for operational excellence in modern networking and reinforce the value of thorough preparation for ENSDWI 300-415 certification.
Cisco CCNP Enterprise 300-415 practice test questions and answers, training course, study guide are uploaded in ETE Files format by real users. Study and Pass 300-415 Implementing Cisco SD-WAN Solutions (ENSDWI) certification exam dumps & practice test questions and answers are to help students.
- 200-301 - Cisco Certified Network Associate (CCNA)
- 350-401 - Implementing Cisco Enterprise Network Core Technologies (ENCOR)
- 350-701 - Implementing and Operating Cisco Security Core Technologies
- 300-410 - Implementing Cisco Enterprise Advanced Routing and Services (ENARSI)
- 300-715 - Implementing and Configuring Cisco Identity Services Engine (300-715 SISE)
- 350-601 - Implementing and Operating Cisco Data Center Core Technologies (DCCOR)
- 300-415 - Implementing Cisco SD-WAN Solutions (ENSDWI)
- 300-710 - Securing Networks with Cisco Firewalls
- 300-420 - Designing Cisco Enterprise Networks (ENSLD)
- 200-901 - DevNet Associate (DEVASC)
- 350-501 - Implementing and Operating Cisco Service Provider Network Core Technologies (SPCOR)
- 400-007 - Cisco Certified Design Expert
- 300-425 - Designing Cisco Enterprise Wireless Networks (300-425 ENWLSD)
- 350-801 - Implementing Cisco Collaboration Core Technologies (CLCOR)
- 200-201 - Understanding Cisco Cybersecurity Operations Fundamentals (CBROPS)
- 300-620 - Implementing Cisco Application Centric Infrastructure (DCACI)
- 500-220 - Cisco Meraki Solutions Specialist
- 300-430 - Implementing Cisco Enterprise Wireless Networks (300-430 ENWLSI)
- 300-730 - Implementing Secure Solutions with Virtual Private Networks (SVPN 300-730)
- 820-605 - Cisco Customer Success Manager (CSM)
- 350-201 - Performing CyberOps Using Core Security Technologies (CBRCOR)
- 300-435 - Automating Cisco Enterprise Solutions (ENAUTO)
- 100-150 - Cisco Certified Support Technician (CCST) Networking
- 300-815 - Implementing Cisco Advanced Call Control and Mobility Services (CLASSM)
- 350-901 - Developing Applications using Cisco Core Platforms and APIs (DEVCOR)
- 300-720 - Securing Email with Cisco Email Security Appliance (300-720 SESA)
- 300-445 - Designing and Implementing Enterprise Network Assurance
- 300-610 - Designing Cisco Data Center Infrastructure for Traditional and AI Workloads
- 300-440 - Designing and Implementing Cloud Connectivity (ENCC)
- 300-510 - Implementing Cisco Service Provider Advanced Routing Solutions (SPRI)
- 700-805 - Cisco Renewals Manager (CRM)
- 300-515 - Implementing Cisco Service Provider VPN Services (SPVI)
- 300-745 - Designing Cisco Security Infrastructure
- 300-725 - Securing the Web with Cisco Web Security Appliance (300-725 SWSA)
- 300-810 - Implementing Cisco Collaboration Applications (CLICA)
- 300-215 - Conducting Forensic Analysis and Incident Response Using Cisco CyberOps Technologies (CBRFIR)
- 300-615 - Troubleshooting Cisco Data Center Infrastructure (DCIT)
- 500-442 - Administering Cisco Contact Center Enterprise
- 300-735 - Automating Cisco Security Solutions (SAUTO)
- 300-820 - Implementing Cisco Collaboration Cloud and Edge Solutions
- 300-630 - Implementing Cisco Application Centric Infrastructure - Advanced
- 300-635 - Automating Cisco Data Center Solutions (DCAUTO)
- 500-420 - Cisco AppDynamics Associate Performance Analyst
- 100-140 - Cisco Certified Support Technician (CCST) IT Support
- 500-470 - Cisco Enterprise Networks SDA, SDWAN and ISE Exam for System Engineers (ENSDENG)
- 100-490 - Cisco Certified Technician Routing & Switching (RSTECH)
Purchase 300-415 Exam Training Products Individually


Why customers love us?
What do our customers say?
The resources provided for the Cisco certification exam were exceptional. The exam dumps and video courses offered clear and concise explanations of each topic. I felt thoroughly prepared for the 300-415 test and passed with ease.
Studying for the Cisco certification exam was a breeze with the comprehensive materials from this site. The detailed study guides and accurate exam dumps helped me understand every concept. I aced the 300-415 exam on my first try!
I was impressed with the quality of the 300-415 preparation materials for the Cisco certification exam. The video courses were engaging, and the study guides covered all the essential topics. These resources made a significant difference in my study routine and overall performance. I went into the exam feeling confident and well-prepared.
The 300-415 materials for the Cisco certification exam were invaluable. They provided detailed, concise explanations for each topic, helping me grasp the entire syllabus. After studying with these resources, I was able to tackle the final test questions confidently and successfully.
Thanks to the comprehensive study guides and video courses, I aced the 300-415 exam. The exam dumps were spot on and helped me understand the types of questions to expect. The certification exam was much less intimidating thanks to their excellent prep materials. So, I highly recommend their services for anyone preparing for this certification exam.
Achieving my Cisco certification was a seamless experience. The detailed study guide and practice questions ensured I was fully prepared for 300-415. The customer support was responsive and helpful throughout my journey. Highly recommend their services for anyone preparing for their certification test.
I couldn't be happier with my certification results! The study materials were comprehensive and easy to understand, making my preparation for the 300-415 stress-free. Using these resources, I was able to pass my exam on the first attempt. They are a must-have for anyone serious about advancing their career.
The practice exams were incredibly helpful in familiarizing me with the actual test format. I felt confident and well-prepared going into my 300-415 certification exam. The support and guidance provided were top-notch. I couldn't have obtained my Cisco certification without these amazing tools!
The materials provided for the 300-415 were comprehensive and very well-structured. The practice tests were particularly useful in building my confidence and understanding the exam format. After using these materials, I felt well-prepared and was able to solve all the questions on the final test with ease. Passing the certification exam was a huge relief! I feel much more competent in my role. Thank you!
The certification prep was excellent. The content was up-to-date and aligned perfectly with the exam requirements. I appreciated the clear explanations and real-world examples that made complex topics easier to grasp. I passed 300-415 successfully. It was a game-changer for my career in IT!

